

because during the yeast extract digestion the pH value of the inoculated sample rose
from 7.5 to 8.5 as a result of NH 3 production, for details see (Ludwig et al. 1992a).
The experiment was stopped after 28 days, because the concentration of the PCCH
isomers remained constant. This may have been caused by a reduced microbial
activity and/or a simultaneously occurring PCCH degradation. This latter aspect will
be discussed in detail below.
The here-derived results imply that the first step of the aerobic transformation of
α-HCH by micro-organisms is the energetically advantageous trans HCl elimination, where each of the α-HCH enantiomers can be dehydrochlorinated to one
specific β-PCCH enantiomer only (Fig. 8.2). The PCCH isomers were identified
by comparison of the retention times on two capillary columns of different polarity
and by cGC/MS.
Basically, the prochiral γ-HCH can form two γ-PCCH enantiomers as shown in
Fig. 8.1. During a non-enzymatic dehydrochlorination of the HCH isomers in an
achiral environment, a racemate as a reaction product is expected (see Chap. 7).
However, in the case of an enzymatic elimination, one would predict a preferential
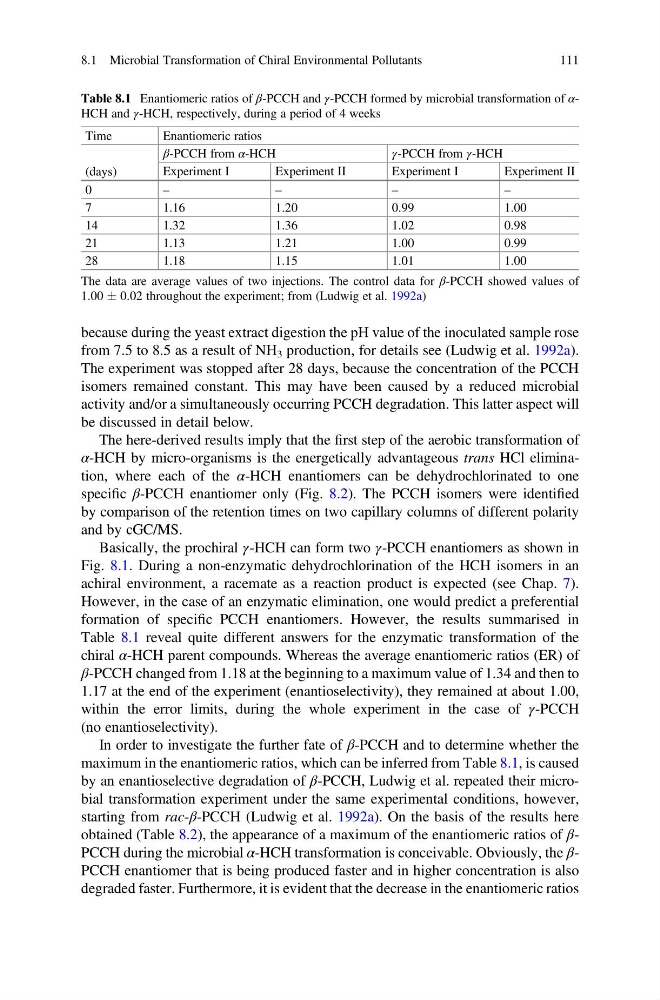
formation of specific PCCH enantiomers. However, the results summarised in
Table 8.1 reveal quite different answers for the enzymatic transformation of the
chiral α-HCH parent compounds. Whereas the average enantiomeric ratios (ER) of
β-PCCH changed from 1.18 at the beginning to a maximum value of 1.34 and then to
1.17 at the end of the experiment (enantioselectivity), they remained at about 1.00,
within the error limits, during the whole experiment in the case of γ-PCCH
(no enantioselectivity).
In order to investigate the further fate of β-PCCH and to determine whether the
maximum in the enantiomeric ratios, which can be inferred from Table 8.1, is caused
by an enantioselective degradation of β-PCCH, Ludwig et al. repeated their microbial transformation experiment under the same experimental conditions, however,
starting from rac-β-PCCH (Ludwig et al. 1992a). On the basis of the results here
obtained (Table 8.2), the appearance of a maximum of the enantiomeric ratios of βPCCH during the microbial α-HCH transformation is conceivable. Obviously, the βPCCH enantiomer that is being produced faster and in higher concentration is also
degraded faster. Furthermore, it is evident that the decrease in the enantiomeric ratios
Table 8.1 Enantiomeric ratios of β-PCCH and γ-PCCH formed by microbial transformation of αHCH and γ-HCH, respectively, during a period of 4 weeks
Time
Enantiomeric ratios
(days)
β-PCCH from α-HCH
γ-PCCH from γ-HCH
Experiment I
Experiment II
Experiment I
Experiment II
0
–
–
–
–
7
1.16
1.20
0.99
1.00
14
1.32
1.36
1.02
0.98
21
1.13
1.21
1.00
0.99
28
1.18
1.15
1.01
1.00
The data are average values of two injections. The control data for β-PCCH showed values of
1.00 Æ 0.02 throughout the experiment; from (Ludwig et al. 1992a)
8.1 Microbial Transformation of Chiral Environmental Pollutants
111
from 7.5 to 8.5 as a result of NH 3 production, for details see (Ludwig et al. 1992a).
The experiment was stopped after 28 days, because the concentration of the PCCH
isomers remained constant. This may have been caused by a reduced microbial
activity and/or a simultaneously occurring PCCH degradation. This latter aspect will
be discussed in detail below.
The here-derived results imply that the first step of the aerobic transformation of
α-HCH by micro-organisms is the energetically advantageous trans HCl elimination, where each of the α-HCH enantiomers can be dehydrochlorinated to one
specific β-PCCH enantiomer only (Fig. 8.2). The PCCH isomers were identified
by comparison of the retention times on two capillary columns of different polarity
and by cGC/MS.
Basically, the prochiral γ-HCH can form two γ-PCCH enantiomers as shown in
Fig. 8.1. During a non-enzymatic dehydrochlorination of the HCH isomers in an
achiral environment, a racemate as a reaction product is expected (see Chap. 7).
However, in the case of an enzymatic elimination, one would predict a preferential
formation of specific PCCH enantiomers. However, the results summarised in
Table 8.1 reveal quite different answers for the enzymatic transformation of the
chiral α-HCH parent compounds. Whereas the average enantiomeric ratios (ER) of
β-PCCH changed from 1.18 at the beginning to a maximum value of 1.34 and then to
1.17 at the end of the experiment (enantioselectivity), they remained at about 1.00,
within the error limits, during the whole experiment in the case of γ-PCCH
(no enantioselectivity).
In order to investigate the further fate of β-PCCH and to determine whether the
maximum in the enantiomeric ratios, which can be inferred from Table 8.1, is caused
by an enantioselective degradation of β-PCCH, Ludwig et al. repeated their microbial transformation experiment under the same experimental conditions, however,
starting from rac-β-PCCH (Ludwig et al. 1992a). On the basis of the results here
obtained (Table 8.2), the appearance of a maximum of the enantiomeric ratios of βPCCH during the microbial α-HCH transformation is conceivable. Obviously, the βPCCH enantiomer that is being produced faster and in higher concentration is also
degraded faster. Furthermore, it is evident that the decrease in the enantiomeric ratios
Table 8.1 Enantiomeric ratios of β-PCCH and γ-PCCH formed by microbial transformation of αHCH and γ-HCH, respectively, during a period of 4 weeks
Time
Enantiomeric ratios
(days)
β-PCCH from α-HCH
γ-PCCH from γ-HCH
Experiment I
Experiment II
Experiment I
Experiment II
0
–
–
–
–
7
1.16
1.20
0.99
1.00
14
1.32
1.36
1.02
0.98
21
1.13
1.21
1.00
0.99
28
1.18
1.15
1.01
1.00
The data are average values of two injections. The control data for β-PCCH showed values of
1.00 Æ 0.02 throughout the experiment; from (Ludwig et al. 1992a)
8.1 Microbial Transformation of Chiral Environmental Pollutants
111