

54
S. Liphadzi et al.
The informed evidence from the WEF nexus integrative model provides opportunities to operationalise the WEF nexus through the theory of change, an inclusive
stakeholder engagement meant to reach an informed common goal [88].
3.4 Overview of WEF Nexus Indicators (2015 and 2018)
The WEF nexus analytical model has simplified the interpretation and understanding
of the complex interactions between the interlinked WEF resources. This quantitative evidence of the interconnectedness of the three resources provides the basis to
identify priority sectors for intervention that would lead to sustainability [57]. An
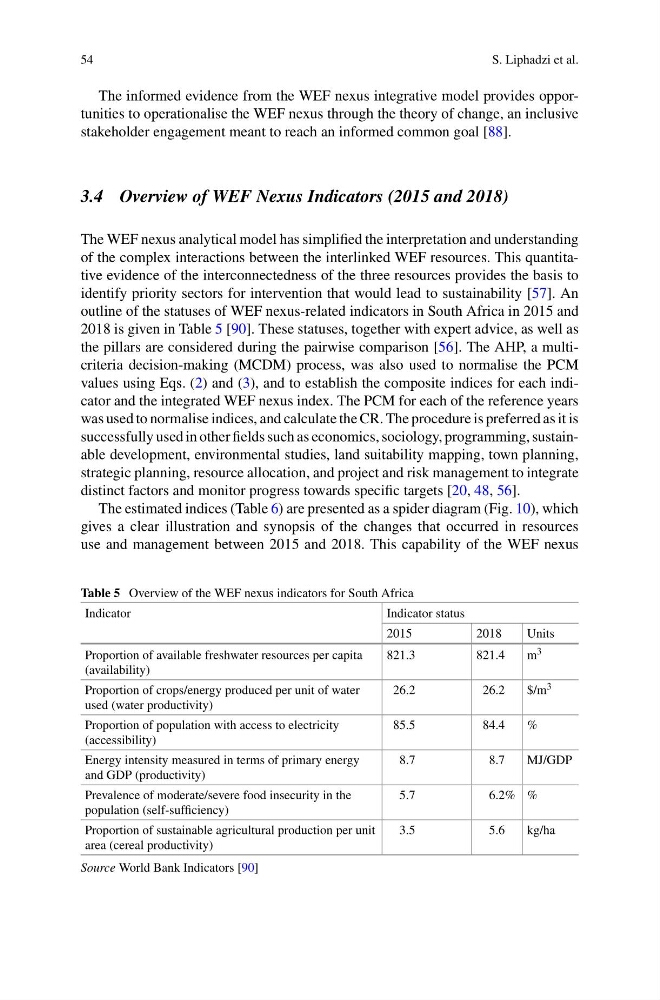
outline of the statuses of WEF nexus-related indicators in South Africa in 2015 and
2018 is given in Table 5 [90]. These statuses, together with expert advice, as well as
the pillars are considered during the pairwise comparison [56]. The AHP, a multicriteria decision-making (MCDM) process, was also used to normalise the PCM
values using Eqs. (2) and (3), and to establish the composite indices for each indicator and the integrated WEF nexus index. The PCM for each of the reference years
was used to normalise indices, and calculate the CR. The procedure is preferred as it is
successfully used in other fields such as economics, sociology, programming, sustainable development, environmental studies, land suitability mapping, town planning,
strategic planning, resource allocation, and project and risk management to integrate
distinct factors and monitor progress towards specific targets [20, 48, 56].
The estimated indices (Table 6) are presented as a spider diagram (Fig. 10), which
gives a clear illustration and synopsis of the changes that occurred in resources
use and management between 2015 and 2018. This capability of the WEF nexus
Table 5 Overview of the WEF nexus indicators for South Africa
Indicator
Indicator status
2015
2018
Units
Proportion of available freshwater resources per capita
(availability)
821.3
821.4
m 3
Proportion of crops/energy produced per unit of water
used (water productivity)
26.2
26.2
$/m 3
Proportion of population with access to electricity
(accessibility)
85.5
84.4
%
Energy intensity measured in terms of primary energy
and GDP (productivity)
8.7
8.7
MJ/GDP
Prevalence of moderate/severe food insecurity in the
population (self-sufficiency)
5.7
6.2% %
Proportion of sustainable agricultural production per unit
area (cereal productivity)
3.5
5.6
kg/ha
Source World Bank Indicators [90]
S. Liphadzi et al.
The informed evidence from the WEF nexus integrative model provides opportunities to operationalise the WEF nexus through the theory of change, an inclusive
stakeholder engagement meant to reach an informed common goal [88].
3.4 Overview of WEF Nexus Indicators (2015 and 2018)
The WEF nexus analytical model has simplified the interpretation and understanding
of the complex interactions between the interlinked WEF resources. This quantitative evidence of the interconnectedness of the three resources provides the basis to
identify priority sectors for intervention that would lead to sustainability [57]. An
outline of the statuses of WEF nexus-related indicators in South Africa in 2015 and
2018 is given in Table 5 [90]. These statuses, together with expert advice, as well as
the pillars are considered during the pairwise comparison [56]. The AHP, a multicriteria decision-making (MCDM) process, was also used to normalise the PCM
values using Eqs. (2) and (3), and to establish the composite indices for each indicator and the integrated WEF nexus index. The PCM for each of the reference years
was used to normalise indices, and calculate the CR. The procedure is preferred as it is
successfully used in other fields such as economics, sociology, programming, sustainable development, environmental studies, land suitability mapping, town planning,
strategic planning, resource allocation, and project and risk management to integrate
distinct factors and monitor progress towards specific targets [20, 48, 56].
The estimated indices (Table 6) are presented as a spider diagram (Fig. 10), which
gives a clear illustration and synopsis of the changes that occurred in resources
use and management between 2015 and 2018. This capability of the WEF nexus
Table 5 Overview of the WEF nexus indicators for South Africa
Indicator
Indicator status
2015
2018
Units
Proportion of available freshwater resources per capita
(availability)
821.3
821.4
m 3
Proportion of crops/energy produced per unit of water
used (water productivity)
26.2
26.2
$/m 3
Proportion of population with access to electricity
(accessibility)
85.5
84.4
%
Energy intensity measured in terms of primary energy
and GDP (productivity)
8.7
8.7
MJ/GDP
Prevalence of moderate/severe food insecurity in the
population (self-sufficiency)
5.7
6.2% %
Proportion of sustainable agricultural production per unit
area (cereal productivity)
3.5
5.6
kg/ha
Source World Bank Indicators [90]