

The Evolution of the Water–Energy–Food Nexus …
53
Table 4 WEF nexus indicator performance classification categories
Indicator
Unsustainable
Marginally
sustainable
Moderately
sustainable
Highly sustainable
Water availability
(m 3 /per capita)
<1700
1700–6000
6001–15,000
>15,000
Water productivity
(US$/m 3 )
<10
10–20
21–100
>100
Food
self-sufficiency (%
of pop)
>30
15–29
5–14
<5
Cereal productivity
(kg/ha)
<500
501–2000
2001–4000
>4000
Energy accessibility
(% of pop)
<20
21–50
51–89
90–100
Energy productivity
(MJ/GDP)
>9
6–9
3–5
<3
WEF nexus
composite index
0–09
0.1–0.2
0.3–0.6
0.7–1
Source Nhamo et al. [56]
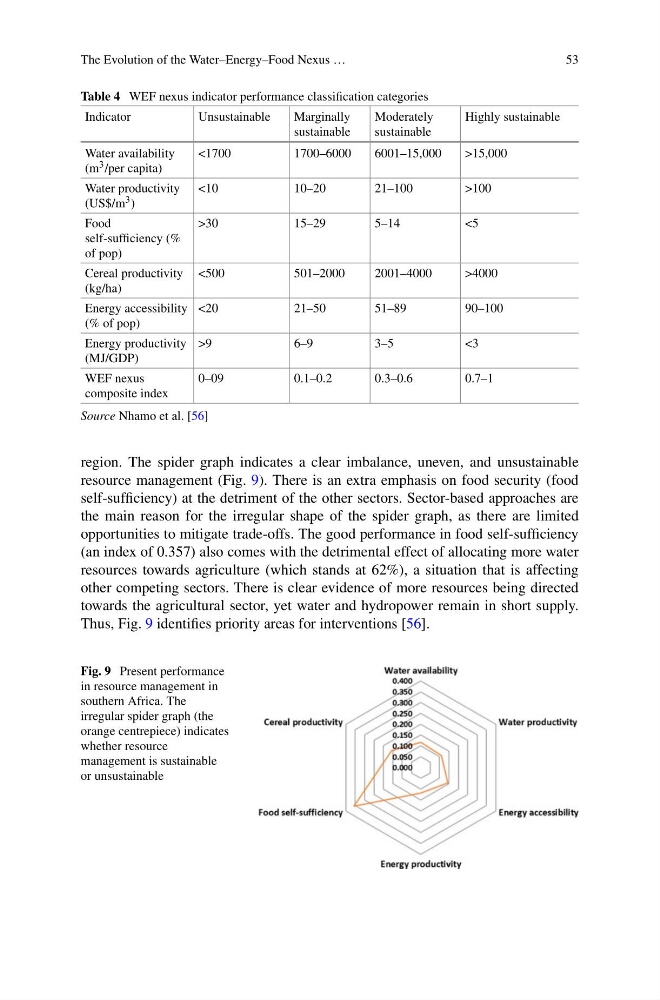
region. The spider graph indicates a clear imbalance, uneven, and unsustainable
resource management (Fig. 9). There is an extra emphasis on food security (food
self-sufficiency) at the detriment of the other sectors. Sector-based approaches are
the main reason for the irregular shape of the spider graph, as there are limited
opportunities to mitigate trade-offs. The good performance in food self-sufficiency
(an index of 0.357) also comes with the detrimental effect of allocating more water
resources towards agriculture (which stands at 62%), a situation that is affecting
other competing sectors. There is clear evidence of more resources being directed
towards the agricultural sector, yet water and hydropower remain in short supply.
Thus, Fig. 9 identifies priority areas for interventions [56].
Fig. 9 Present performance
in resource management in
southern Africa. The
irregular spider graph (the
orange centrepiece) indicates
whether resource
management is sustainable
or unsustainable
53
Table 4 WEF nexus indicator performance classification categories
Indicator
Unsustainable
Marginally
sustainable
Moderately
sustainable
Highly sustainable
Water availability
(m 3 /per capita)
<1700
1700–6000
6001–15,000
>15,000
Water productivity
(US$/m 3 )
<10
10–20
21–100
>100
Food
self-sufficiency (%
of pop)
>30
15–29
5–14
<5
Cereal productivity
(kg/ha)
<500
501–2000
2001–4000
>4000
Energy accessibility
(% of pop)
<20
21–50
51–89
90–100
Energy productivity
(MJ/GDP)
>9
6–9
3–5
<3
WEF nexus
composite index
0–09
0.1–0.2
0.3–0.6
0.7–1
Source Nhamo et al. [56]
region. The spider graph indicates a clear imbalance, uneven, and unsustainable
resource management (Fig. 9). There is an extra emphasis on food security (food
self-sufficiency) at the detriment of the other sectors. Sector-based approaches are
the main reason for the irregular shape of the spider graph, as there are limited
opportunities to mitigate trade-offs. The good performance in food self-sufficiency
(an index of 0.357) also comes with the detrimental effect of allocating more water
resources towards agriculture (which stands at 62%), a situation that is affecting
other competing sectors. There is clear evidence of more resources being directed
towards the agricultural sector, yet water and hydropower remain in short supply.
Thus, Fig. 9 identifies priority areas for interventions [56].
Fig. 9 Present performance
in resource management in
southern Africa. The
irregular spider graph (the
orange centrepiece) indicates
whether resource
management is sustainable
or unsustainable