

• realistically depict the spatial variability of soils in the
landscape;
• capture most of the data collected in the field from
pre-existing mapping programmes along with new data;
• provide indices of uncertainty for each attribute
described;
• provide the most accurate and up‐to‐date soil data ‘to the
kitchen table’ via the Internet; and
• automatically generate data and derivative maps to provide a range of data formats and interpretations, including
derivative maps of properties, such as drainage classes,
depth to rock, or depth to an impeding layer.
One of the main advantages of digital soil maps over
other mapping techniques is that the techniques are transparent, repeatable, and up-dateable (when more information
becomes available), and that probability maps are provided
with model and validation statistics.
By 2020, S-map coverage of New Zealand had reached
about 37%, but coverage of intensively used land, including
horticulture, cropping, and intensive pasture, had reached
67%. Currently, S-map is being extended and new tools and
applications are being added. A soil database platform
(one-stop-shop) has been developed, namely the Land
Resource Information System (LRIS, which includes S-map
and the National Soil Data Repository http://lris.scinfo.org.
nz/#). Already the LRIS portal contains a wealth of readily
accessible information about soils in New Zealand and is
undergoing continuing development and upgrade.
In addition to the development of digital soil maps, soil
profile data are now being acquired using digital tools
including (digital) cameras, hand-held portable X-ray
fluorescence devices (pXRF) for elemental analysis in the
field, and various spectrometers that have been used to
predict a wide array of physical and chemical properties
(once the results are matched and calibrated against traditional lab measurements of the properties, such as grain
sizes, bulk density, and soil organic carbon). The use of
these devices to digitally characterise soils is referred to as
digital soil morphometrics, defined as the application of
instruments and techniques for measuring, mapping, and
quantifying soil properties.
18.4.4 New Zealand Land Resource Inventory
and Land Use Capability Classifications
The New Zealand Land Resource Inventory (NZLRI) and
the derived Land Use Capability (LUC) classifications were
adapted for New Zealand from the system first published by
the Soil Conservation Service, US Department of Agriculture, in 1961. The Water and Soil Division of the Ministry of
Works developed the original database, and the first edition
of the LUC Survey Handbook for New Zealand was published in 1971. Although primarily developed to help provide an inventory of erosion and potential mitigation, it has
subsequently become much more. In the 3rd edition (published in 2009), LUC classification is defined as ‘a systematic arrangement of different kinds of land according to those
properties that determine its capacity for long-term sustained
production’. Ian Lynn and colleagues at Manaaki Whenua
– Landcare Research have continued the update and management of the database.
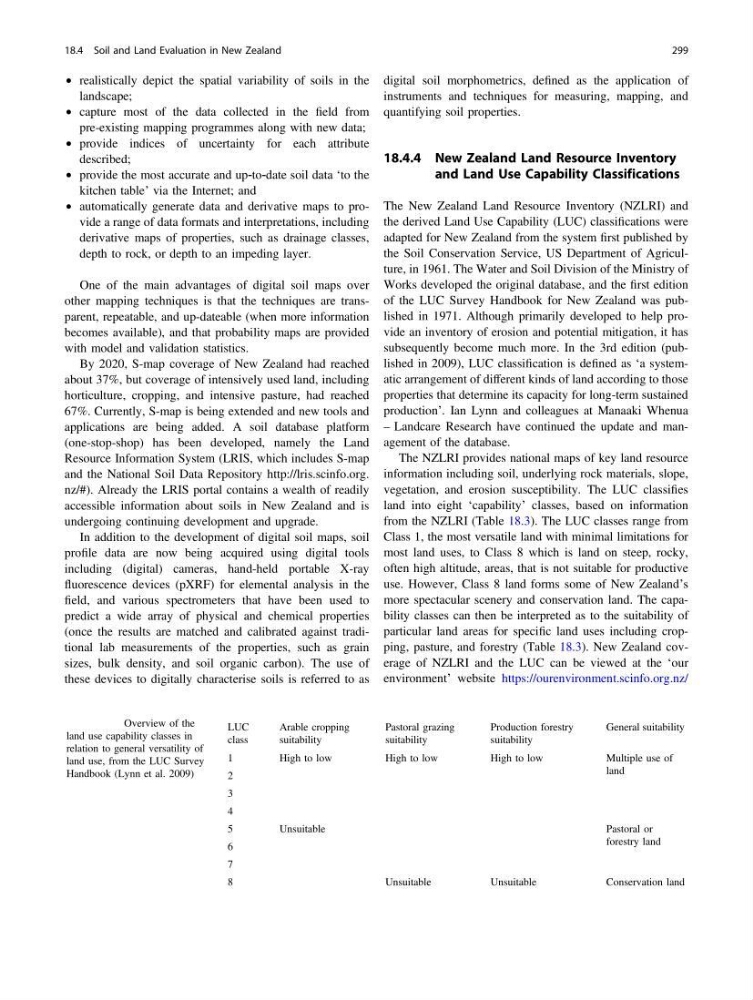
The NZLRI provides national maps of key land resource
information including soil, underlying rock materials, slope,
vegetation, and erosion susceptibility. The LUC classifies
land into eight ‘capability’ classes, based on information
from the NZLRI (Table 18.3). The LUC classes range from
Class 1, the most versatile land with minimal limitations for
most land uses, to Class 8 which is land on steep, rocky,
often high altitude, areas, that is not suitable for productive
use. However, Class 8 land forms some of New Zealand’s
more spectacular scenery and conservation land. The capability classes can then be interpreted as to the suitability of
particular land areas for specific land uses including cropping, pasture, and forestry (Table 18.3). New Zealand coverage of NZLRI and the LUC can be viewed at the ‘our
environment’ website https://ourenvironment.scinfo.org.nz/
Table 18.3 Overview of the
land use capability classes in
relation to general versatility of
land use, from the LUC Survey
Handbook (Lynn et al. 2009)
LUC
class
Arable cropping
suitability
Pastoral grazing
suitability
Production forestry
suitability
General suitability
1
High to low
High to low
High to low
Multiple use of
land
2
3
4
5
Unsuitable
Pastoral or
forestry land
6
7
8
Unsuitable
Unsuitable
Conservation land
18.4 Soil and Land Evaluation in New Zealand
299
landscape;
• capture most of the data collected in the field from
pre-existing mapping programmes along with new data;
• provide indices of uncertainty for each attribute
described;
• provide the most accurate and up‐to‐date soil data ‘to the
kitchen table’ via the Internet; and
• automatically generate data and derivative maps to provide a range of data formats and interpretations, including
derivative maps of properties, such as drainage classes,
depth to rock, or depth to an impeding layer.
One of the main advantages of digital soil maps over
other mapping techniques is that the techniques are transparent, repeatable, and up-dateable (when more information
becomes available), and that probability maps are provided
with model and validation statistics.
By 2020, S-map coverage of New Zealand had reached
about 37%, but coverage of intensively used land, including
horticulture, cropping, and intensive pasture, had reached
67%. Currently, S-map is being extended and new tools and
applications are being added. A soil database platform
(one-stop-shop) has been developed, namely the Land
Resource Information System (LRIS, which includes S-map
and the National Soil Data Repository http://lris.scinfo.org.
nz/#). Already the LRIS portal contains a wealth of readily
accessible information about soils in New Zealand and is
undergoing continuing development and upgrade.
In addition to the development of digital soil maps, soil
profile data are now being acquired using digital tools
including (digital) cameras, hand-held portable X-ray
fluorescence devices (pXRF) for elemental analysis in the
field, and various spectrometers that have been used to
predict a wide array of physical and chemical properties
(once the results are matched and calibrated against traditional lab measurements of the properties, such as grain
sizes, bulk density, and soil organic carbon). The use of
these devices to digitally characterise soils is referred to as
digital soil morphometrics, defined as the application of
instruments and techniques for measuring, mapping, and
quantifying soil properties.
18.4.4 New Zealand Land Resource Inventory
and Land Use Capability Classifications
The New Zealand Land Resource Inventory (NZLRI) and
the derived Land Use Capability (LUC) classifications were
adapted for New Zealand from the system first published by
the Soil Conservation Service, US Department of Agriculture, in 1961. The Water and Soil Division of the Ministry of
Works developed the original database, and the first edition
of the LUC Survey Handbook for New Zealand was published in 1971. Although primarily developed to help provide an inventory of erosion and potential mitigation, it has
subsequently become much more. In the 3rd edition (published in 2009), LUC classification is defined as ‘a systematic arrangement of different kinds of land according to those
properties that determine its capacity for long-term sustained
production’. Ian Lynn and colleagues at Manaaki Whenua
– Landcare Research have continued the update and management of the database.
The NZLRI provides national maps of key land resource
information including soil, underlying rock materials, slope,
vegetation, and erosion susceptibility. The LUC classifies
land into eight ‘capability’ classes, based on information
from the NZLRI (Table 18.3). The LUC classes range from
Class 1, the most versatile land with minimal limitations for
most land uses, to Class 8 which is land on steep, rocky,
often high altitude, areas, that is not suitable for productive
use. However, Class 8 land forms some of New Zealand’s
more spectacular scenery and conservation land. The capability classes can then be interpreted as to the suitability of
particular land areas for specific land uses including cropping, pasture, and forestry (Table 18.3). New Zealand coverage of NZLRI and the LUC can be viewed at the ‘our
environment’ website https://ourenvironment.scinfo.org.nz/
Table 18.3 Overview of the
land use capability classes in
relation to general versatility of
land use, from the LUC Survey
Handbook (Lynn et al. 2009)
LUC
class
Arable cropping
suitability
Pastoral grazing
suitability
Production forestry
suitability
General suitability
1
High to low
High to low
High to low
Multiple use of
land
2
3
4
5
Unsuitable
Pastoral or
forestry land
6
7
8
Unsuitable
Unsuitable
Conservation land
18.4 Soil and Land Evaluation in New Zealand
299