

and at https://lris.scinfo.org.nz/layer/48076-nzlri-land-usecapability/.
The data for the NZLRI were assembled from a range of
previously published soil and geological maps complemented
by aerial photograph interpretation and some field
ground-truthing. It has been periodically reviewed and updated.
Like all GIS, map-based information care should be exercised
in its interpretation. The original target scale for the NZLRI was
1:63,360 (now 1:50,000) and some of it was based on the
1:253,440 (four miles to the inch) scale maps. While it is possible to zoom in to much larger scales, as a visualisation tool, the
map units need to be ground-truthed to ensure accuracy at the
farm or paddock-scale, i.e. there are fundamental differences
between the scale at which soils on a parcel of land were surveyed, the scale at which a map was presented or published, and
the scale at which the map can be viewed in a GIS.
As the first complete national inventory of soils, rock
type, slope, erosion, and vegetation, the NZLRI was an
important accomplishment and widely used in many applications, including some that were beyond those anticipated
by the original designers and mappers. The LUC system has
been, and remains, an important tool in sustainable land
management and is now embedded in legislation (e.g. LUC
surveys are integrated into the ‘One Plan’ of the Horizons
[Manawatu-Whanganui] Regional Council, which defines
how the natural and physical resources are to be cared for
and managed).
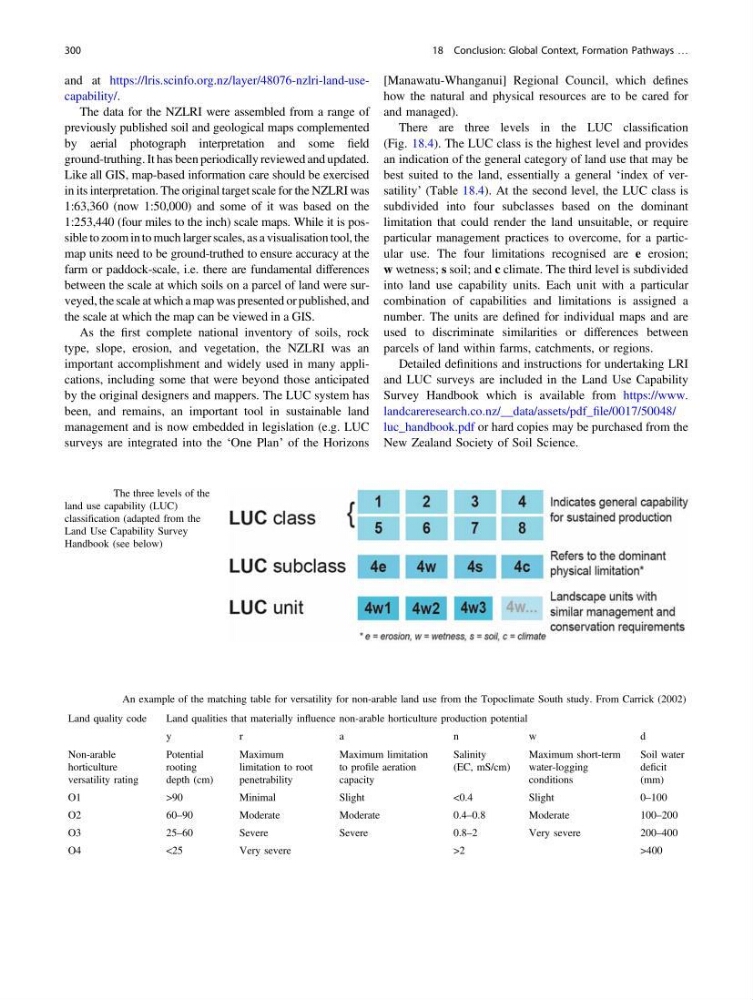
There are three levels in the LUC classification
(Fig. 18.4). The LUC class is the highest level and provides
an indication of the general category of land use that may be
best suited to the land, essentially a general ‘index of versatility’ (Table 18.4). At the second level, the LUC class is
subdivided into four subclasses based on the dominant
limitation that could render the land unsuitable, or require
particular management practices to overcome, for a particular use. The four limitations recognised are e erosion;
w wetness; s soil; and c climate. The third level is subdivided
into land use capability units. Each unit with a particular
combination of capabilities and limitations is assigned a
number. The units are defined for individual maps and are
used to discriminate similarities or differences between
parcels of land within farms, catchments, or regions.
Detailed definitions and instructions for undertaking LRI
and LUC surveys are included in the Land Use Capability
Survey Handbook which is available from https://www.
landcareresearch.co.nz/__data/assets/pdf_file/0017/50048/
luc_handbook.pdf or hard copies may be purchased from the
New Zealand Society of Soil Science.
Fig. 18.4 The three levels of the
land use capability (LUC)
classification (adapted from the
Land Use Capability Survey
Handbook (see below)
Table 18.4 An example of the matching table for versatility for non-arable land use from the Topoclimate South study. From Carrick (2002)
Land quality code
Land qualities that materially influence non-arable horticulture production potential
y
r
a
n
w
d
Non-arable
horticulture
versatility rating
Potential
rooting
depth (cm)
Maximum
limitation to root
penetrability
Maximum limitation
to profile aeration
capacity
Salinity
(EC, mS/cm)
Maximum short-term
water-logging
conditions
Soil water
deficit
(mm)
O1
>90
Minimal
Slight
<0.4
Slight
0–100
O2
60–90
Moderate
Moderate
0.4–0.8
Moderate
100–200
O3
25–60
Severe
Severe
0.8–2
Very severe
200–400
O4
<25
Very severe
>2
>400
300
18 Conclusion: Global Context, Formation Pathways …
The data for the NZLRI were assembled from a range of
previously published soil and geological maps complemented
by aerial photograph interpretation and some field
ground-truthing. It has been periodically reviewed and updated.
Like all GIS, map-based information care should be exercised
in its interpretation. The original target scale for the NZLRI was
1:63,360 (now 1:50,000) and some of it was based on the
1:253,440 (four miles to the inch) scale maps. While it is possible to zoom in to much larger scales, as a visualisation tool, the
map units need to be ground-truthed to ensure accuracy at the
farm or paddock-scale, i.e. there are fundamental differences
between the scale at which soils on a parcel of land were surveyed, the scale at which a map was presented or published, and
the scale at which the map can be viewed in a GIS.
As the first complete national inventory of soils, rock
type, slope, erosion, and vegetation, the NZLRI was an
important accomplishment and widely used in many applications, including some that were beyond those anticipated
by the original designers and mappers. The LUC system has
been, and remains, an important tool in sustainable land
management and is now embedded in legislation (e.g. LUC
surveys are integrated into the ‘One Plan’ of the Horizons
[Manawatu-Whanganui] Regional Council, which defines
how the natural and physical resources are to be cared for
and managed).
There are three levels in the LUC classification
(Fig. 18.4). The LUC class is the highest level and provides
an indication of the general category of land use that may be
best suited to the land, essentially a general ‘index of versatility’ (Table 18.4). At the second level, the LUC class is
subdivided into four subclasses based on the dominant
limitation that could render the land unsuitable, or require
particular management practices to overcome, for a particular use. The four limitations recognised are e erosion;
w wetness; s soil; and c climate. The third level is subdivided
into land use capability units. Each unit with a particular
combination of capabilities and limitations is assigned a
number. The units are defined for individual maps and are
used to discriminate similarities or differences between
parcels of land within farms, catchments, or regions.
Detailed definitions and instructions for undertaking LRI
and LUC surveys are included in the Land Use Capability
Survey Handbook which is available from https://www.
landcareresearch.co.nz/__data/assets/pdf_file/0017/50048/
luc_handbook.pdf or hard copies may be purchased from the
New Zealand Society of Soil Science.
Fig. 18.4 The three levels of the
land use capability (LUC)
classification (adapted from the
Land Use Capability Survey
Handbook (see below)
Table 18.4 An example of the matching table for versatility for non-arable land use from the Topoclimate South study. From Carrick (2002)
Land quality code
Land qualities that materially influence non-arable horticulture production potential
y
r
a
n
w
d
Non-arable
horticulture
versatility rating
Potential
rooting
depth (cm)
Maximum
limitation to root
penetrability
Maximum limitation
to profile aeration
capacity
Salinity
(EC, mS/cm)
Maximum short-term
water-logging
conditions
Soil water
deficit
(mm)
O1
>90
Minimal
Slight
<0.4
Slight
0–100
O2
60–90
Moderate
Moderate
0.4–0.8
Moderate
100–200
O3
25–60
Severe
Severe
0.8–2
Very severe
200–400
O4
<25
Very severe
>2
>400
300
18 Conclusion: Global Context, Formation Pathways …