

806
S. Stoychev et al.
0
2,000
4,000
6,000
8,000
10,000
12,000
14,000
0
10,000
20,000
30,000
40,000
50,000
60,000
70,000
2009 2010 2011 2012 2013 2014 2015 2016 2017 2018
t Zn
t dry
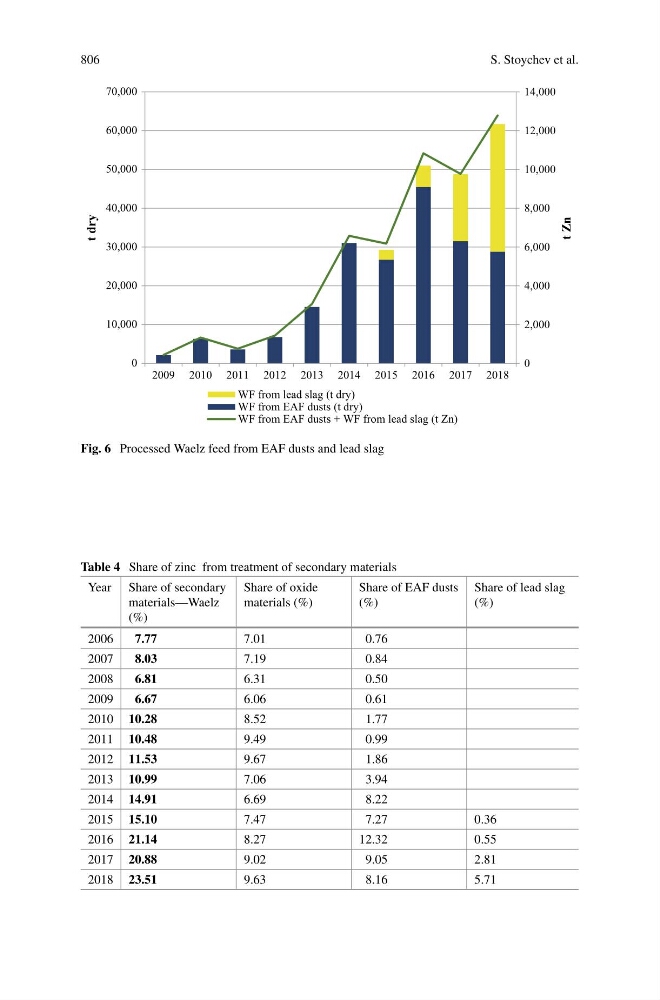
WF from lead slag (t dry)
WF from EAF dusts (t dry)
WF from EAF dusts + WF from lead slag (t Zn)
Fig. 6 Processed Waelz feed from EAF dusts and lead slag
Table 4 Share of zinc from treatment of secondary materials
Year Share of secondary
materials—Waelz
(%)
Share of oxide
materials (%)
Share of EAF dusts
(%)
Share of lead slag
(%)
2006
7.77
7.01
0.76
2007
8.03
7.19
0.84
2008
6.81
6.31
0.50
2009
6.67
6.06
0.61
2010 10.28
8.52
1.77
2011 10.48
9.49
0.99
2012 11.53
9.67
1.86
2013 10.99
7.06
3.94
2014 14.91
6.69
8.22
2015 15.10
7.47
7.27
0.36
2016 21.14
8.27
12.32
0.55
2017 20.88
9.02
9.05
2.81
2018 23.51
9.63
8.16
5.71