

792
M. Maccagni and E. Guerrini
by high cell temperatures (>75 °C). It is significant to note that the high contamination of the electrolyte, caused by a period of poor purification, did not affect the
current efficiency even in presence of elements like Sb, Ni, and Co. These elements,
which are disastrous in acidic sulphate electrolyte, did not disturb the EZINEX
®
Process. The only consequence was the co-deposition of the metals into the zinc
cathodes creating a lower quality product.
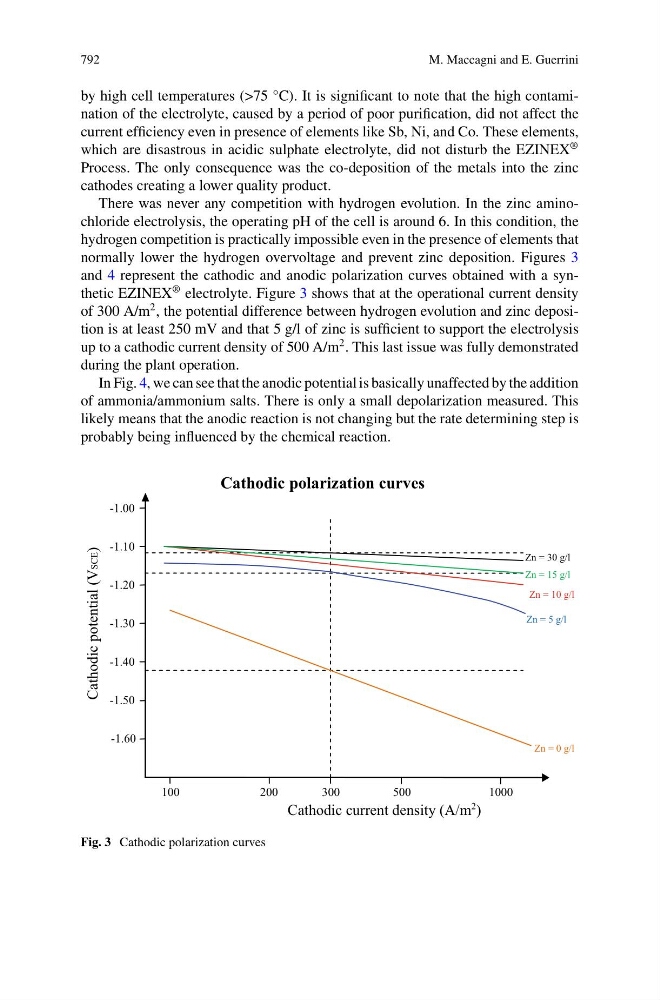
There was never any competition with hydrogen evolution. In the zinc aminochloride electrolysis, the operating pH of the cell is around 6. In this condition, the
hydrogen competition is practically impossible even in the presence of elements that
normally lower the hydrogen overvoltage and prevent zinc deposition. Figures 3
and 4 represent the cathodic and anodic polarization curves obtained with a synthetic EZINEX
® electrolyte. Figure 3 shows that at the operational current density
of 300 A/m
2 , the potential difference between hydrogen evolution and zinc deposition is at least 250 mV and that 5 g/l of zinc is sufficient to support the electrolysis
up to a cathodic current density of 500 A/m
2 . This last issue was fully demonstrated
during the plant operation.
In Fig. 4, we can see that the anodic potential is basically unaffected by the addition
of ammonia/ammonium salts. There is only a small depolarization measured. This
likely means that the anodic reaction is not changing but the rate determining step is
probably being influenced by the chemical reaction.
Cathodic current density (A/m
2 )
1000
500
300
100
Cathodic potential (VSCE)
-1.20
-1.30
-1.40
-1.50
-1.60
-1.10
-1.00
200
Cathodic polarization curves
Zn = 30 g/l
Zn = 15 g/l
Zn = 10 g/l
Zn = 5 g/l
Zn = 0 g/l
Fig. 3 Cathodic polarization curves