

Studies on the Formation of Intermetallic Compound Layers …
667
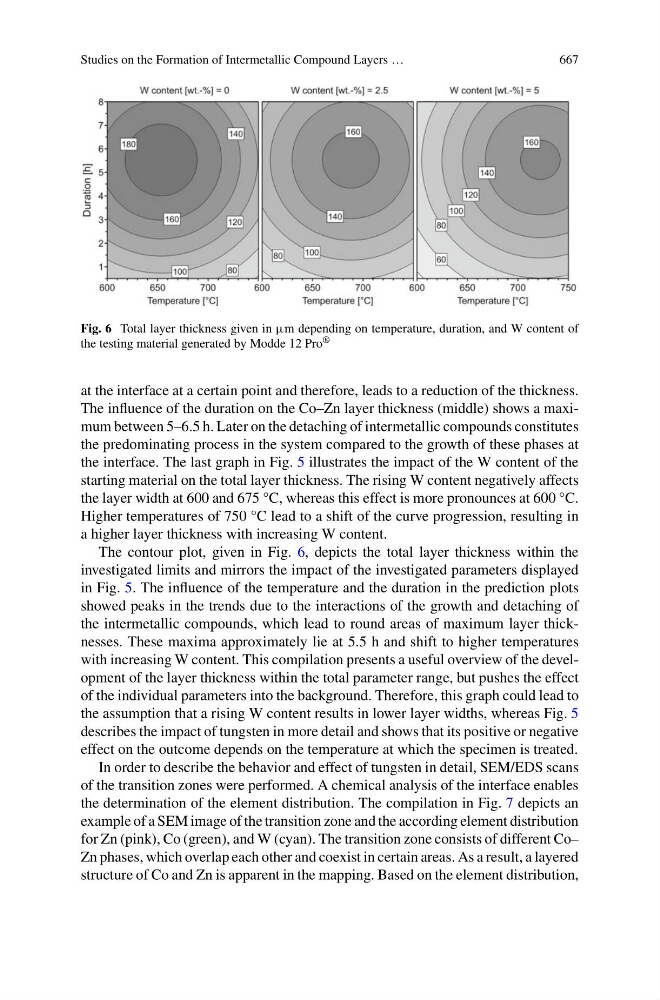
Fig. 6 Total layer thickness given in μm depending on temperature, duration, and W content of
the testing material generated by Modde 12 Pro ®
at the interface at a certain point and therefore, leads to a reduction of the thickness.
The influence of the duration on the Co–Zn layer thickness (middle) shows a maximum between 5–6.5 h. Later on the detaching of intermetallic compounds constitutes
the predominating process in the system compared to the growth of these phases at
the interface. The last graph in Fig. 5 illustrates the impact of the W content of the
starting material on the total layer thickness. The rising W content negatively affects
the layer width at 600 and 675 °C, whereas this effect is more pronounces at 600 °C.
Higher temperatures of 750 °C lead to a shift of the curve progression, resulting in
a higher layer thickness with increasing W content.
The contour plot, given in Fig. 6, depicts the total layer thickness within the
investigated limits and mirrors the impact of the investigated parameters displayed
in Fig. 5. The influence of the temperature and the duration in the prediction plots
showed peaks in the trends due to the interactions of the growth and detaching of
the intermetallic compounds, which lead to round areas of maximum layer thicknesses. These maxima approximately lie at 5.5 h and shift to higher temperatures
with increasing W content. This compilation presents a useful overview of the development of the layer thickness within the total parameter range, but pushes the effect
of the individual parameters into the background. Therefore, this graph could lead to
the assumption that a rising W content results in lower layer widths, whereas Fig. 5
describes the impact of tungsten in more detail and shows that its positive or negative
effect on the outcome depends on the temperature at which the specimen is treated.
In order to describe the behavior and effect of tungsten in detail, SEM/EDS scans
of the transition zones were performed. A chemical analysis of the interface enables
the determination of the element distribution. The compilation in Fig. 7 depicts an
example of a SEM image of the transition zone and the according element distribution
for Zn (pink), Co (green), and W (cyan). The transition zone consists of different Co–
Zn phases, which overlap each other and coexist in certain areas. As a result, a layered
structure of Co and Zn is apparent in the mapping. Based on the element distribution,