

666
T. Ebner et al.
MODDE 12 Pro
® . The test designation covers the applied temperature, duration,
and testing material, thus, M1 was treated for 0.5 h at 600 °C in the experiment
600 0.5 M1. Since the transition zone between Co(W) and Zn exhibits an irregular
surface, the measurement is afflicted with a certain error, which should be taken into
consideration while evaluating the results.
Beyond that, SEM/EDS analyses of the transition zones were performed in order
to determine the distribution of the elements Co, Zn, and especially W and to describe
the behavior and the impact of the W content in Co on the Co–Zn phase formation.
This allows us to draw conclusions regarding its impact on the recyclability of certain
cemented carbide grades.
Results and Discussion
During the treatment of the Co(W) testing material with liquid zinc for a certain
duration at a distinct temperature, the formation of Co–Zn phases occurs at the interface due to mutual diffusion processes of Co and Zn. At a certain point, these phases
detach into the molten zinc. The simultaneously occurring growth and detaching of
the intermetallic compounds affects the total layer thickness. In order to describe the
growth of intermetallic Co–Zn compounds and the effect of dissolved tungsten in the
binder on the formation of these phases, the average of the total layer thicknesses was
evaluated by the statistic software MODDE 12 Pro
® . The resulting prediction plots,
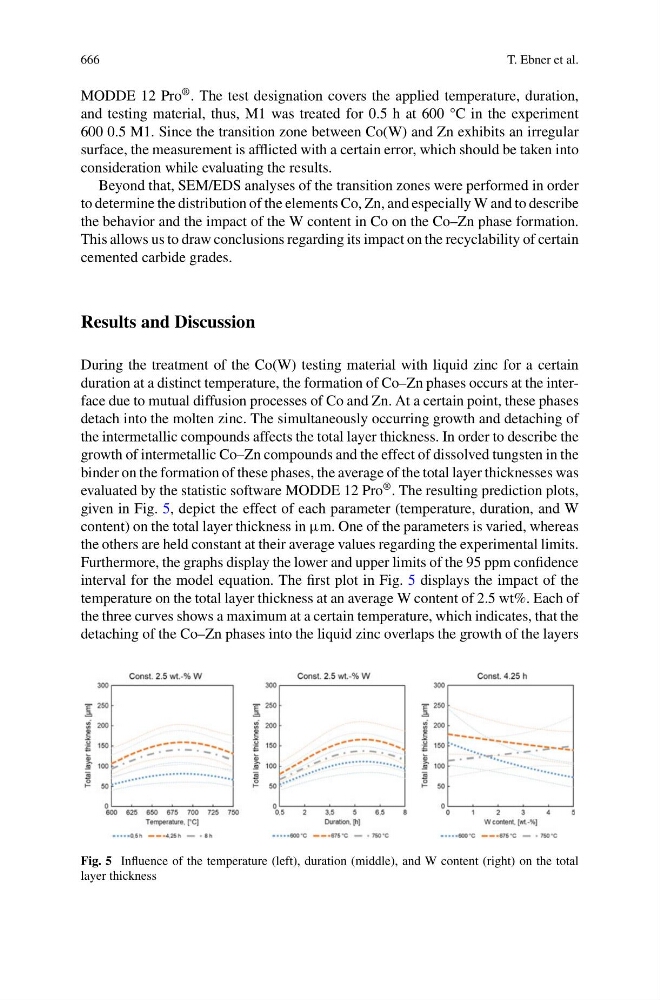
given in Fig. 5, depict the effect of each parameter (temperature, duration, and W
content) on the total layer thickness in μm. One of the parameters is varied, whereas
the others are held constant at their average values regarding the experimental limits.
Furthermore, the graphs display the lower and upper limits of the 95 ppm confidence
interval for the model equation. The first plot in Fig. 5 displays the impact of the
temperature on the total layer thickness at an average W content of 2.5 wt%. Each of
the three curves shows a maximum at a certain temperature, which indicates, that the
detaching of the Co–Zn phases into the liquid zinc overlaps the growth of the layers
Fig. 5 Influence of the temperature (left), duration (middle), and W content (right) on the total
layer thickness