

Reduction of Lead-Rich Slags with Coke in the Lead Blast Furnace
179
Results and Discussion
In the results section, the focus is on the SEM secondary electron images and EDX
analysis of coke surfaces after they have been subjected to the dripping experiments.
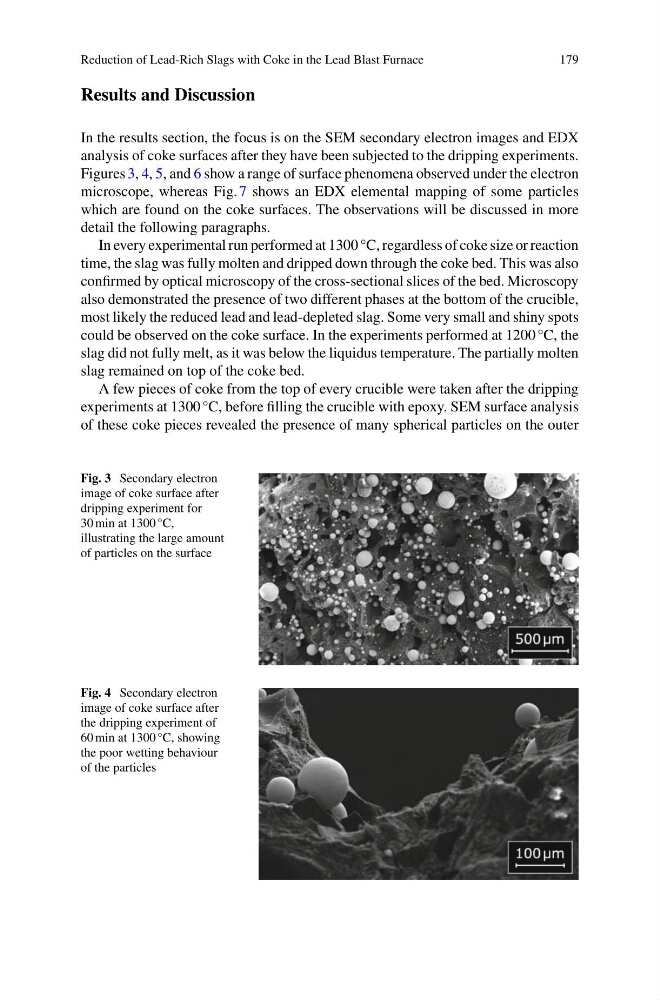
Figures 3, 4, 5, and 6 show a range of surface phenomena observed under the electron
microscope, whereas Fig. 7 shows an EDX elemental mapping of some particles
which are found on the coke surfaces. The observations will be discussed in more
detail the following paragraphs.
In every experimental run performed at 1300 °C, regardless of coke size or reaction
time, the slag was fully molten and dripped down through the coke bed. This was also
confirmed by optical microscopy of the cross-sectional slices of the bed. Microscopy
also demonstrated the presence of two different phases at the bottom of the crucible,
most likely the reduced lead and lead-depleted slag. Some very small and shiny spots
could be observed on the coke surface. In the experiments performed at 1200 °C, the
slag did not fully melt, as it was below the liquidus temperature. The partially molten
slag remained on top of the coke bed.
A few pieces of coke from the top of every crucible were taken after the dripping
experiments at 1300 °C, before filling the crucible with epoxy. SEM surface analysis
of these coke pieces revealed the presence of many spherical particles on the outer
Fig. 3 Secondary electron
image of coke surface after
dripping experiment for
30 min at 1300 °C,
illustrating the large amount
of particles on the surface
Fig. 4 Secondary electron
image of coke surface after
the dripping experiment of
60 min at 1300 °C, showing
the poor wetting behaviour
of the particles
179
Results and Discussion
In the results section, the focus is on the SEM secondary electron images and EDX
analysis of coke surfaces after they have been subjected to the dripping experiments.
Figures 3, 4, 5, and 6 show a range of surface phenomena observed under the electron
microscope, whereas Fig. 7 shows an EDX elemental mapping of some particles
which are found on the coke surfaces. The observations will be discussed in more
detail the following paragraphs.
In every experimental run performed at 1300 °C, regardless of coke size or reaction
time, the slag was fully molten and dripped down through the coke bed. This was also
confirmed by optical microscopy of the cross-sectional slices of the bed. Microscopy
also demonstrated the presence of two different phases at the bottom of the crucible,
most likely the reduced lead and lead-depleted slag. Some very small and shiny spots
could be observed on the coke surface. In the experiments performed at 1200 °C, the
slag did not fully melt, as it was below the liquidus temperature. The partially molten
slag remained on top of the coke bed.
A few pieces of coke from the top of every crucible were taken after the dripping
experiments at 1300 °C, before filling the crucible with epoxy. SEM surface analysis
of these coke pieces revealed the presence of many spherical particles on the outer
Fig. 3 Secondary electron
image of coke surface after
dripping experiment for
30 min at 1300 °C,
illustrating the large amount
of particles on the surface
Fig. 4 Secondary electron
image of coke surface after
the dripping experiment of
60 min at 1300 °C, showing
the poor wetting behaviour
of the particles