

116
M. Moats and T. Hymer
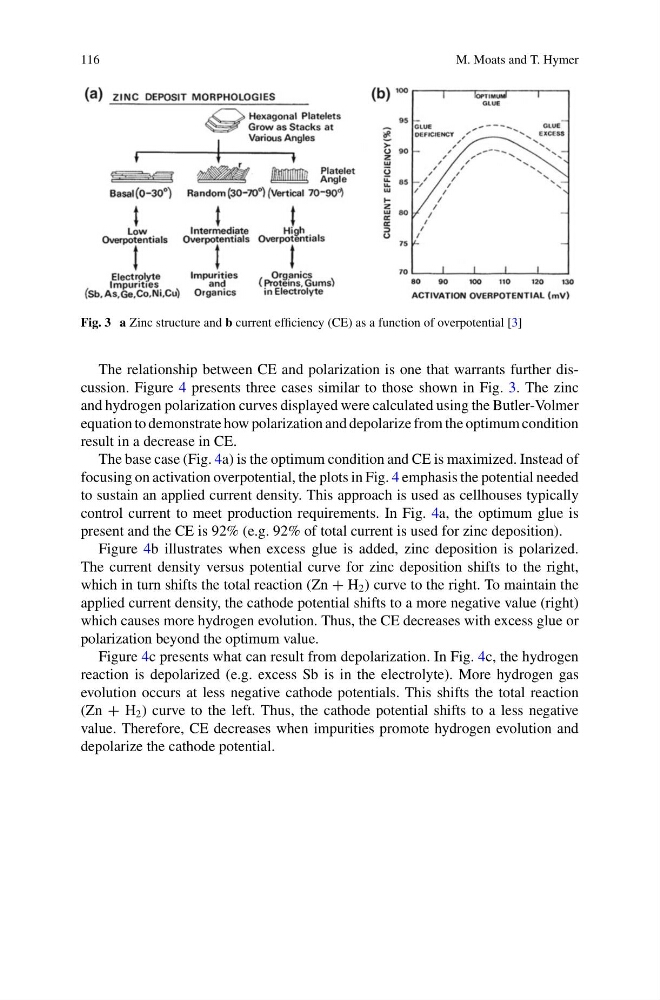
Fig. 3 a Zinc structure and b current efficiency (CE) as a function of overpotential [3]
The relationship between CE and polarization is one that warrants further discussion. Figure 4 presents three cases similar to those shown in Fig. 3. The zinc
and hydrogen polarization curves displayed were calculated using the Butler-Volmer
equation to demonstrate how polarization and depolarize from the optimum condition
result in a decrease in CE.
The base case (Fig. 4a) is the optimum condition and CE is maximized. Instead of
focusing on activation overpotential, the plots in Fig. 4 emphasis the potential needed
to sustain an applied current density. This approach is used as cellhouses typically
control current to meet production requirements. In Fig. 4a, the optimum glue is
present and the CE is 92% (e.g. 92% of total current is used for zinc deposition).
Figure 4b illustrates when excess glue is added, zinc deposition is polarized.
The current density versus potential curve for zinc deposition shifts to the right,
which in turn shifts the total reaction (Zn + H 2 ) curve to the right. To maintain the
applied current density, the cathode potential shifts to a more negative value (right)
which causes more hydrogen evolution. Thus, the CE decreases with excess glue or
polarization beyond the optimum value.
Figure 4c presents what can result from depolarization. In Fig. 4c, the hydrogen
reaction is depolarized (e.g. excess Sb is in the electrolyte). More hydrogen gas
evolution occurs at less negative cathode potentials. This shifts the total reaction
(Zn + H 2 ) curve to the left. Thus, the cathode potential shifts to a less negative
value. Therefore, CE decreases when impurities promote hydrogen evolution and
depolarize the cathode potential.
M. Moats and T. Hymer
Fig. 3 a Zinc structure and b current efficiency (CE) as a function of overpotential [3]
The relationship between CE and polarization is one that warrants further discussion. Figure 4 presents three cases similar to those shown in Fig. 3. The zinc
and hydrogen polarization curves displayed were calculated using the Butler-Volmer
equation to demonstrate how polarization and depolarize from the optimum condition
result in a decrease in CE.
The base case (Fig. 4a) is the optimum condition and CE is maximized. Instead of
focusing on activation overpotential, the plots in Fig. 4 emphasis the potential needed
to sustain an applied current density. This approach is used as cellhouses typically
control current to meet production requirements. In Fig. 4a, the optimum glue is
present and the CE is 92% (e.g. 92% of total current is used for zinc deposition).
Figure 4b illustrates when excess glue is added, zinc deposition is polarized.
The current density versus potential curve for zinc deposition shifts to the right,
which in turn shifts the total reaction (Zn + H 2 ) curve to the right. To maintain the
applied current density, the cathode potential shifts to a more negative value (right)
which causes more hydrogen evolution. Thus, the CE decreases with excess glue or
polarization beyond the optimum value.
Figure 4c presents what can result from depolarization. In Fig. 4c, the hydrogen
reaction is depolarized (e.g. excess Sb is in the electrolyte). More hydrogen gas
evolution occurs at less negative cathode potentials. This shifts the total reaction
(Zn + H 2 ) curve to the left. Thus, the cathode potential shifts to a less negative
value. Therefore, CE decreases when impurities promote hydrogen evolution and
depolarize the cathode potential.