

To Polarize or Not to Polarize: Practical Advice on How …
115
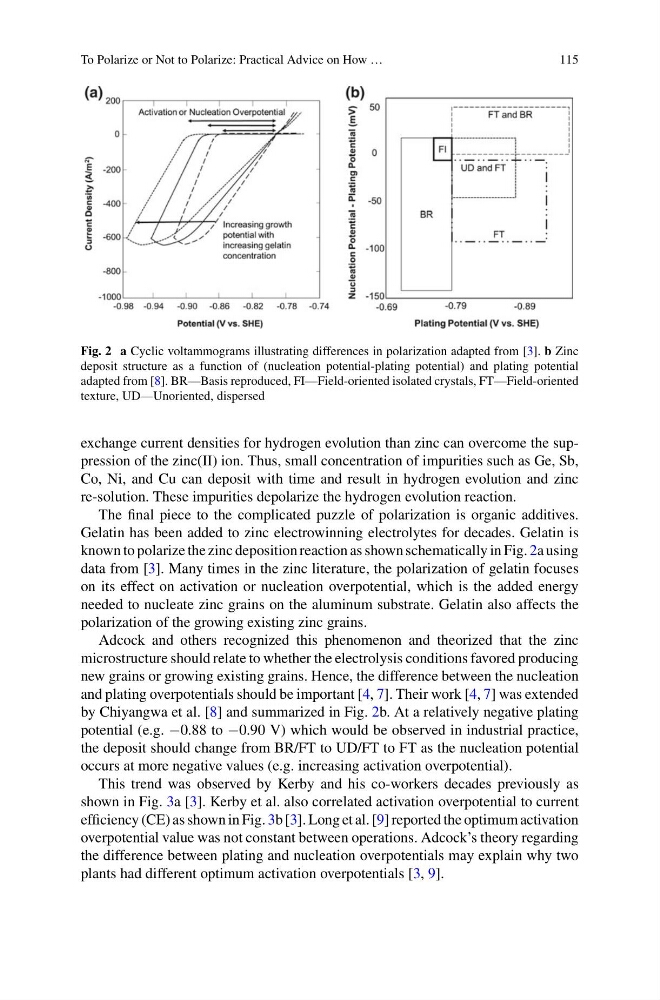
Fig. 2 a Cyclic voltammograms illustrating differences in polarization adapted from [3]. b Zinc
deposit structure as a function of (nucleation potential-plating potential) and plating potential
adapted from [8]. BR—Basis reproduced, FI—Field-oriented isolated crystals, FT—Field-oriented
texture, UD—Unoriented, dispersed
exchange current densities for hydrogen evolution than zinc can overcome the suppression of the zinc(II) ion. Thus, small concentration of impurities such as Ge, Sb,
Co, Ni, and Cu can deposit with time and result in hydrogen evolution and zinc
re-solution. These impurities depolarize the hydrogen evolution reaction.
The final piece to the complicated puzzle of polarization is organic additives.
Gelatin has been added to zinc electrowinning electrolytes for decades. Gelatin is
known to polarize the zinc deposition reaction as shown schematically in Fig. 2a using
data from [3]. Many times in the zinc literature, the polarization of gelatin focuses
on its effect on activation or nucleation overpotential, which is the added energy
needed to nucleate zinc grains on the aluminum substrate. Gelatin also affects the
polarization of the growing existing zinc grains.
Adcock and others recognized this phenomenon and theorized that the zinc
microstructure should relate to whether the electrolysis conditions favored producing
new grains or growing existing grains. Hence, the difference between the nucleation
and plating overpotentials should be important [4, 7]. Their work [4, 7] was extended
by Chiyangwa et al. [8] and summarized in Fig. 2b. At a relatively negative plating
potential (e.g. −0.88 to −0.90 V) which would be observed in industrial practice,
the deposit should change from BR/FT to UD/FT to FT as the nucleation potential
occurs at more negative values (e.g. increasing activation overpotential).
This trend was observed by Kerby and his co-workers decades previously as
shown in Fig. 3a [3]. Kerby et al. also correlated activation overpotential to current
efficiency (CE) as shown in Fig. 3b [3]. Long et al. [9] reported the optimum activation
overpotential value was not constant between operations. Adcock’s theory regarding
the difference between plating and nucleation overpotentials may explain why two
plants had different optimum activation overpotentials [3, 9].
115
Fig. 2 a Cyclic voltammograms illustrating differences in polarization adapted from [3]. b Zinc
deposit structure as a function of (nucleation potential-plating potential) and plating potential
adapted from [8]. BR—Basis reproduced, FI—Field-oriented isolated crystals, FT—Field-oriented
texture, UD—Unoriented, dispersed
exchange current densities for hydrogen evolution than zinc can overcome the suppression of the zinc(II) ion. Thus, small concentration of impurities such as Ge, Sb,
Co, Ni, and Cu can deposit with time and result in hydrogen evolution and zinc
re-solution. These impurities depolarize the hydrogen evolution reaction.
The final piece to the complicated puzzle of polarization is organic additives.
Gelatin has been added to zinc electrowinning electrolytes for decades. Gelatin is
known to polarize the zinc deposition reaction as shown schematically in Fig. 2a using
data from [3]. Many times in the zinc literature, the polarization of gelatin focuses
on its effect on activation or nucleation overpotential, which is the added energy
needed to nucleate zinc grains on the aluminum substrate. Gelatin also affects the
polarization of the growing existing zinc grains.
Adcock and others recognized this phenomenon and theorized that the zinc
microstructure should relate to whether the electrolysis conditions favored producing
new grains or growing existing grains. Hence, the difference between the nucleation
and plating overpotentials should be important [4, 7]. Their work [4, 7] was extended
by Chiyangwa et al. [8] and summarized in Fig. 2b. At a relatively negative plating
potential (e.g. −0.88 to −0.90 V) which would be observed in industrial practice,
the deposit should change from BR/FT to UD/FT to FT as the nucleation potential
occurs at more negative values (e.g. increasing activation overpotential).
This trend was observed by Kerby and his co-workers decades previously as
shown in Fig. 3a [3]. Kerby et al. also correlated activation overpotential to current
efficiency (CE) as shown in Fig. 3b [3]. Long et al. [9] reported the optimum activation
overpotential value was not constant between operations. Adcock’s theory regarding
the difference between plating and nucleation overpotentials may explain why two
plants had different optimum activation overpotentials [3, 9].