

3.4 X-Ray Diffraction and Raman Spectroscopy Studies
27
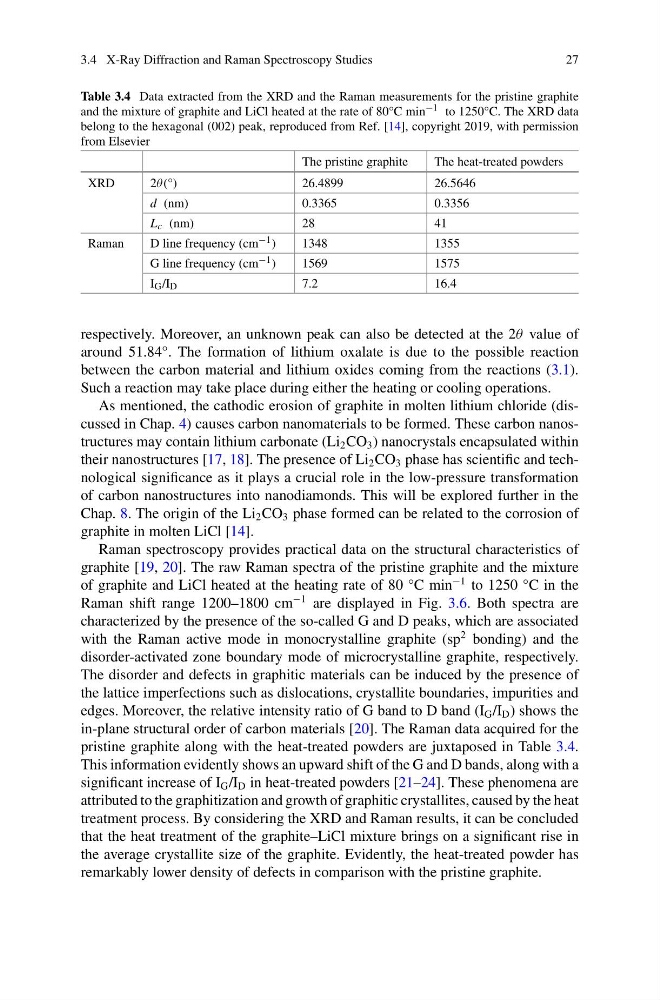
Table 3.4 Data extracted from the XRD and the Raman measurements for the pristine graphite
and the mixture of graphite and LiCl heated at the rate of 80°C min −1 to 1250°C. The XRD data
belong to the hexagonal (002) peak, reproduced from Ref. [14], copyright 2019, with permission
from Elsevier
The pristine graphite
The heat-treated powders
XRD
2θ(°)
26.4899
26.5646
d (nm)
0.3365
0.3356
L c (nm)
28
41
Raman
D line frequency (cm −1 )
1348
1355
G line frequency (cm −1 )
1569
1575
I G /I D
7.2
16.4
respectively. Moreover, an unknown peak can also be detected at the 2θ value of
around 51.84°. The formation of lithium oxalate is due to the possible reaction
between the carbon material and lithium oxides coming from the reactions (3.1).
Such a reaction may take place during either the heating or cooling operations.
As mentioned, the cathodic erosion of graphite in molten lithium chloride (discussed in Chap. 4) causes carbon nanomaterials to be formed. These carbon nanostructures may contain lithium carbonate (Li 2 CO 3 ) nanocrystals encapsulated within
their nanostructures [17, 18]. The presence of Li 2 CO 3 phase has scientific and technological significance as it plays a crucial role in the low-pressure transformation
of carbon nanostructures into nanodiamonds. This will be explored further in the
Chap. 8. The origin of the Li 2 CO 3 phase formed can be related to the corrosion of
graphite in molten LiCl [14].
Raman spectroscopy provides practical data on the structural characteristics of
graphite [19, 20]. The raw Raman spectra of the pristine graphite and the mixture
of graphite and LiCl heated at the heating rate of 80 °C min
−1 to 1250 °C in the
Raman shift range 1200–1800 cm
−1 are displayed in Fig. 3.6. Both spectra are
characterized by the presence of the so-called G and D peaks, which are associated
with the Raman active mode in monocrystalline graphite (sp
2 bonding) and the
disorder-activated zone boundary mode of microcrystalline graphite, respectively.
The disorder and defects in graphitic materials can be induced by the presence of
the lattice imperfections such as dislocations, crystallite boundaries, impurities and
edges. Moreover, the relative intensity ratio of G band to D band (I G /I D ) shows the
in-plane structural order of carbon materials [20]. The Raman data acquired for the
pristine graphite along with the heat-treated powders are juxtaposed in Table 3.4.
This information evidently shows an upward shift of the G and D bands, along with a
significant increase of I G /I D in heat-treated powders [21–24]. These phenomena are
attributed to the graphitization and growth of graphitic crystallites, caused by the heat
treatment process. By considering the XRD and Raman results, it can be concluded
that the heat treatment of the graphite–LiCl mixture brings on a significant rise in
the average crystallite size of the graphite. Evidently, the heat-treated powder has
remarkably lower density of defects in comparison with the pristine graphite.
27
Table 3.4 Data extracted from the XRD and the Raman measurements for the pristine graphite
and the mixture of graphite and LiCl heated at the rate of 80°C min −1 to 1250°C. The XRD data
belong to the hexagonal (002) peak, reproduced from Ref. [14], copyright 2019, with permission
from Elsevier
The pristine graphite
The heat-treated powders
XRD
2θ(°)
26.4899
26.5646
d (nm)
0.3365
0.3356
L c (nm)
28
41
Raman
D line frequency (cm −1 )
1348
1355
G line frequency (cm −1 )
1569
1575
I G /I D
7.2
16.4
respectively. Moreover, an unknown peak can also be detected at the 2θ value of
around 51.84°. The formation of lithium oxalate is due to the possible reaction
between the carbon material and lithium oxides coming from the reactions (3.1).
Such a reaction may take place during either the heating or cooling operations.
As mentioned, the cathodic erosion of graphite in molten lithium chloride (discussed in Chap. 4) causes carbon nanomaterials to be formed. These carbon nanostructures may contain lithium carbonate (Li 2 CO 3 ) nanocrystals encapsulated within
their nanostructures [17, 18]. The presence of Li 2 CO 3 phase has scientific and technological significance as it plays a crucial role in the low-pressure transformation
of carbon nanostructures into nanodiamonds. This will be explored further in the
Chap. 8. The origin of the Li 2 CO 3 phase formed can be related to the corrosion of
graphite in molten LiCl [14].
Raman spectroscopy provides practical data on the structural characteristics of
graphite [19, 20]. The raw Raman spectra of the pristine graphite and the mixture
of graphite and LiCl heated at the heating rate of 80 °C min
−1 to 1250 °C in the
Raman shift range 1200–1800 cm
−1 are displayed in Fig. 3.6. Both spectra are
characterized by the presence of the so-called G and D peaks, which are associated
with the Raman active mode in monocrystalline graphite (sp
2 bonding) and the
disorder-activated zone boundary mode of microcrystalline graphite, respectively.
The disorder and defects in graphitic materials can be induced by the presence of
the lattice imperfections such as dislocations, crystallite boundaries, impurities and
edges. Moreover, the relative intensity ratio of G band to D band (I G /I D ) shows the
in-plane structural order of carbon materials [20]. The Raman data acquired for the
pristine graphite along with the heat-treated powders are juxtaposed in Table 3.4.
This information evidently shows an upward shift of the G and D bands, along with a
significant increase of I G /I D in heat-treated powders [21–24]. These phenomena are
attributed to the graphitization and growth of graphitic crystallites, caused by the heat
treatment process. By considering the XRD and Raman results, it can be concluded
that the heat treatment of the graphite–LiCl mixture brings on a significant rise in
the average crystallite size of the graphite. Evidently, the heat-treated powder has
remarkably lower density of defects in comparison with the pristine graphite.