

26
3 Interaction of Molten Salts with Graphite
3.4 X-Ray Diffraction and Raman Spectroscopy Studies
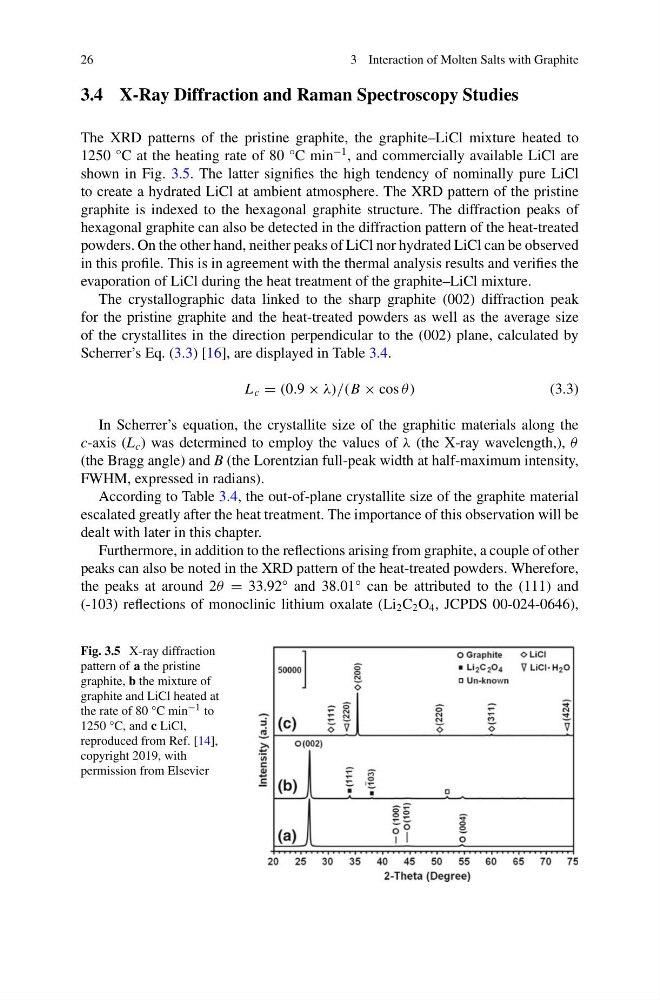
The XRD patterns of the pristine graphite, the graphite–LiCl mixture heated to
1250 °C at the heating rate of 80 °C min
−1 , and commercially available LiCl are
shown in Fig. 3.5. The latter signifies the high tendency of nominally pure LiCl
to create a hydrated LiCl at ambient atmosphere. The XRD pattern of the pristine
graphite is indexed to the hexagonal graphite structure. The diffraction peaks of
hexagonal graphite can also be detected in the diffraction pattern of the heat-treated
powders. On the other hand, neither peaks of LiCl nor hydrated LiCl can be observed
in this profile. This is in agreement with the thermal analysis results and verifies the
evaporation of LiCl during the heat treatment of the graphite–LiCl mixture.
The crystallographic data linked to the sharp graphite (002) diffraction peak
for the pristine graphite and the heat-treated powders as well as the average size
of the crystallites in the direction perpendicular to the (002) plane, calculated by
Scherrer’s Eq. (3.3) [16], are displayed in Table 3.4.
L c = (0.9 × λ)/(B × cos θ )
(3.3)
In Scherrer’s equation, the crystallite size of the graphitic materials along the
c-axis (L c ) was determined to employ the values of λ (the X-ray wavelength,), θ
(the Bragg angle) and B (the Lorentzian full-peak width at half-maximum intensity,
FWHM, expressed in radians).
According to Table 3.4, the out-of-plane crystallite size of the graphite material
escalated greatly after the heat treatment. The importance of this observation will be
dealt with later in this chapter.
Furthermore, in addition to the reflections arising from graphite, a couple of other
peaks can also be noted in the XRD pattern of the heat-treated powders. Wherefore,
the peaks at around 2θ = 33.92° and 38.01° can be attributed to the (111) and
(-103) reflections of monoclinic lithium oxalate (Li 2 C 2 O 4 , JCPDS 00-024-0646),
Fig. 3.5 X-ray diffraction
pattern of a the pristine
graphite, b the mixture of
graphite and LiCl heated at
the rate of 80 °C min −1 to
1250 °C, and c LiCl,
reproduced from Ref. [14],
copyright 2019, with
permission from Elsevier
3 Interaction of Molten Salts with Graphite
3.4 X-Ray Diffraction and Raman Spectroscopy Studies
The XRD patterns of the pristine graphite, the graphite–LiCl mixture heated to
1250 °C at the heating rate of 80 °C min
−1 , and commercially available LiCl are
shown in Fig. 3.5. The latter signifies the high tendency of nominally pure LiCl
to create a hydrated LiCl at ambient atmosphere. The XRD pattern of the pristine
graphite is indexed to the hexagonal graphite structure. The diffraction peaks of
hexagonal graphite can also be detected in the diffraction pattern of the heat-treated
powders. On the other hand, neither peaks of LiCl nor hydrated LiCl can be observed
in this profile. This is in agreement with the thermal analysis results and verifies the
evaporation of LiCl during the heat treatment of the graphite–LiCl mixture.
The crystallographic data linked to the sharp graphite (002) diffraction peak
for the pristine graphite and the heat-treated powders as well as the average size
of the crystallites in the direction perpendicular to the (002) plane, calculated by
Scherrer’s Eq. (3.3) [16], are displayed in Table 3.4.
L c = (0.9 × λ)/(B × cos θ )
(3.3)
In Scherrer’s equation, the crystallite size of the graphitic materials along the
c-axis (L c ) was determined to employ the values of λ (the X-ray wavelength,), θ
(the Bragg angle) and B (the Lorentzian full-peak width at half-maximum intensity,
FWHM, expressed in radians).
According to Table 3.4, the out-of-plane crystallite size of the graphite material
escalated greatly after the heat treatment. The importance of this observation will be
dealt with later in this chapter.
Furthermore, in addition to the reflections arising from graphite, a couple of other
peaks can also be noted in the XRD pattern of the heat-treated powders. Wherefore,
the peaks at around 2θ = 33.92° and 38.01° can be attributed to the (111) and
(-103) reflections of monoclinic lithium oxalate (Li 2 C 2 O 4 , JCPDS 00-024-0646),
Fig. 3.5 X-ray diffraction
pattern of a the pristine
graphite, b the mixture of
graphite and LiCl heated at
the rate of 80 °C min −1 to
1250 °C, and c LiCl,
reproduced from Ref. [14],
copyright 2019, with
permission from Elsevier