

3.3 Thermal Analysis of the Graphite–LiCl Mixture
25
Table 3.2 Transition temperatures for surface dehydration, melting and evaporation of LiCl
observed during heating of the graphite–LiCl mixture at different heating rates under an ambient
airflow of 100 mL min −1 , reproduced from Ref. [14], copyright 2019, with permission from Elsevier
Heating rate (°C min −1 )
75
80
85
90
Temperature of surface dehydration (°C)
133.8
135.0
136.2
137.3
Temperature of melting (°C)
640.1
641.2
641.6
642.1
Temperature of evaporation (°C)
1189.2
1196.3
1203.2
1209.4
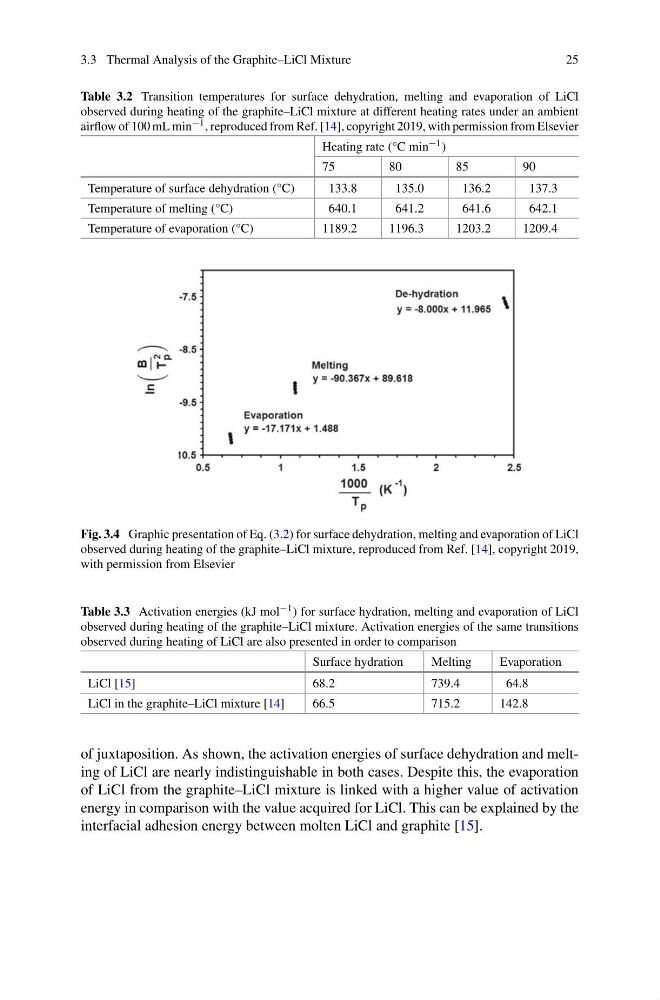
Fig. 3.4 Graphic presentation of Eq. (3.2) for surface dehydration, melting and evaporation of LiCl
observed during heating of the graphite–LiCl mixture, reproduced from Ref. [14], copyright 2019,
with permission from Elsevier
Table 3.3 Activation energies (kJ mol −1 ) for surface hydration, melting and evaporation of LiCl
observed during heating of the graphite–LiCl mixture. Activation energies of the same transitions
observed during heating of LiCl are also presented in order to comparison
Surface hydration
Melting
Evaporation
LiCl [15]
68.2
739.4
64.8
LiCl in the graphite–LiCl mixture [14]
66.5
715.2
142.8
of juxtaposition. As shown, the activation energies of surface dehydration and melting of LiCl are nearly indistinguishable in both cases. Despite this, the evaporation
of LiCl from the graphite–LiCl mixture is linked with a higher value of activation
energy in comparison with the value acquired for LiCl. This can be explained by the
interfacial adhesion energy between molten LiCl and graphite [15].
25
Table 3.2 Transition temperatures for surface dehydration, melting and evaporation of LiCl
observed during heating of the graphite–LiCl mixture at different heating rates under an ambient
airflow of 100 mL min −1 , reproduced from Ref. [14], copyright 2019, with permission from Elsevier
Heating rate (°C min −1 )
75
80
85
90
Temperature of surface dehydration (°C)
133.8
135.0
136.2
137.3
Temperature of melting (°C)
640.1
641.2
641.6
642.1
Temperature of evaporation (°C)
1189.2
1196.3
1203.2
1209.4
Fig. 3.4 Graphic presentation of Eq. (3.2) for surface dehydration, melting and evaporation of LiCl
observed during heating of the graphite–LiCl mixture, reproduced from Ref. [14], copyright 2019,
with permission from Elsevier
Table 3.3 Activation energies (kJ mol −1 ) for surface hydration, melting and evaporation of LiCl
observed during heating of the graphite–LiCl mixture. Activation energies of the same transitions
observed during heating of LiCl are also presented in order to comparison
Surface hydration
Melting
Evaporation
LiCl [15]
68.2
739.4
64.8
LiCl in the graphite–LiCl mixture [14]
66.5
715.2
142.8
of juxtaposition. As shown, the activation energies of surface dehydration and melting of LiCl are nearly indistinguishable in both cases. Despite this, the evaporation
of LiCl from the graphite–LiCl mixture is linked with a higher value of activation
energy in comparison with the value acquired for LiCl. This can be explained by the
interfacial adhesion energy between molten LiCl and graphite [15].