

6.5 Adsorption
99
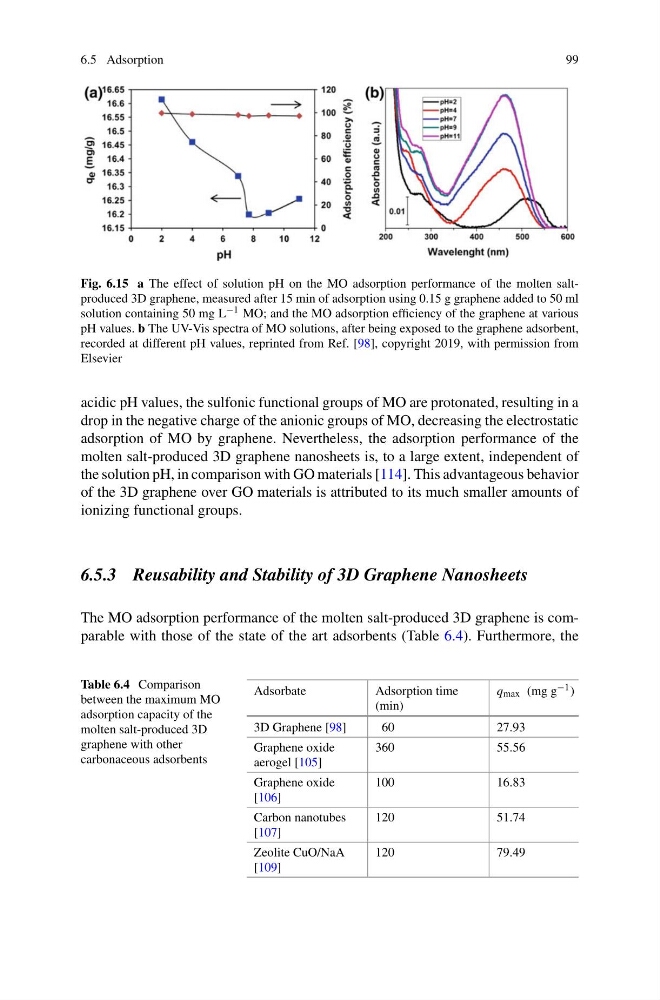
Fig. 6.15 a The effect of solution pH on the MO adsorption performance of the molten saltproduced 3D graphene, measured after 15 min of adsorption using 0.15 g graphene added to 50 ml
solution containing 50 mg L −1 MO; and the MO adsorption efficiency of the graphene at various
pH values. b The UV-Vis spectra of MO solutions, after being exposed to the graphene adsorbent,
recorded at different pH values, reprinted from Ref. [98], copyright 2019, with permission from
Elsevier
acidic pH values, the sulfonic functional groups of MO are protonated, resulting in a
drop in the negative charge of the anionic groups of MO, decreasing the electrostatic
adsorption of MO by graphene. Nevertheless, the adsorption performance of the
molten salt-produced 3D graphene nanosheets is, to a large extent, independent of
the solution pH, in comparison with GO materials [114]. This advantageous behavior
of the 3D graphene over GO materials is attributed to its much smaller amounts of
ionizing functional groups.
6.5.3 Reusability and Stability of 3D Graphene Nanosheets
The MO adsorption performance of the molten salt-produced 3D graphene is comparable with those of the state of the art adsorbents (Table 6.4). Furthermore, the
Table 6.4 Comparison
between the maximum MO
adsorption capacity of the
molten salt-produced 3D
graphene with other
carbonaceous adsorbents
Adsorbate
Adsorption time
(min)
q max (mg g −1 )
3D Graphene [98]
60
27.93
Graphene oxide
aerogel [105]
360
55.56
Graphene oxide
[106]
100
16.83
Carbon nanotubes
[107]
120
51.74
Zeolite CuO/NaA
[109]
120
79.49
99
Fig. 6.15 a The effect of solution pH on the MO adsorption performance of the molten saltproduced 3D graphene, measured after 15 min of adsorption using 0.15 g graphene added to 50 ml
solution containing 50 mg L −1 MO; and the MO adsorption efficiency of the graphene at various
pH values. b The UV-Vis spectra of MO solutions, after being exposed to the graphene adsorbent,
recorded at different pH values, reprinted from Ref. [98], copyright 2019, with permission from
Elsevier
acidic pH values, the sulfonic functional groups of MO are protonated, resulting in a
drop in the negative charge of the anionic groups of MO, decreasing the electrostatic
adsorption of MO by graphene. Nevertheless, the adsorption performance of the
molten salt-produced 3D graphene nanosheets is, to a large extent, independent of
the solution pH, in comparison with GO materials [114]. This advantageous behavior
of the 3D graphene over GO materials is attributed to its much smaller amounts of
ionizing functional groups.
6.5.3 Reusability and Stability of 3D Graphene Nanosheets
The MO adsorption performance of the molten salt-produced 3D graphene is comparable with those of the state of the art adsorbents (Table 6.4). Furthermore, the
Table 6.4 Comparison
between the maximum MO
adsorption capacity of the
molten salt-produced 3D
graphene with other
carbonaceous adsorbents
Adsorbate
Adsorption time
(min)
q max (mg g −1 )
3D Graphene [98]
60
27.93
Graphene oxide
aerogel [105]
360
55.56
Graphene oxide
[106]
100
16.83
Carbon nanotubes
[107]
120
51.74
Zeolite CuO/NaA
[109]
120
79.49