

6.5 Adsorption
93
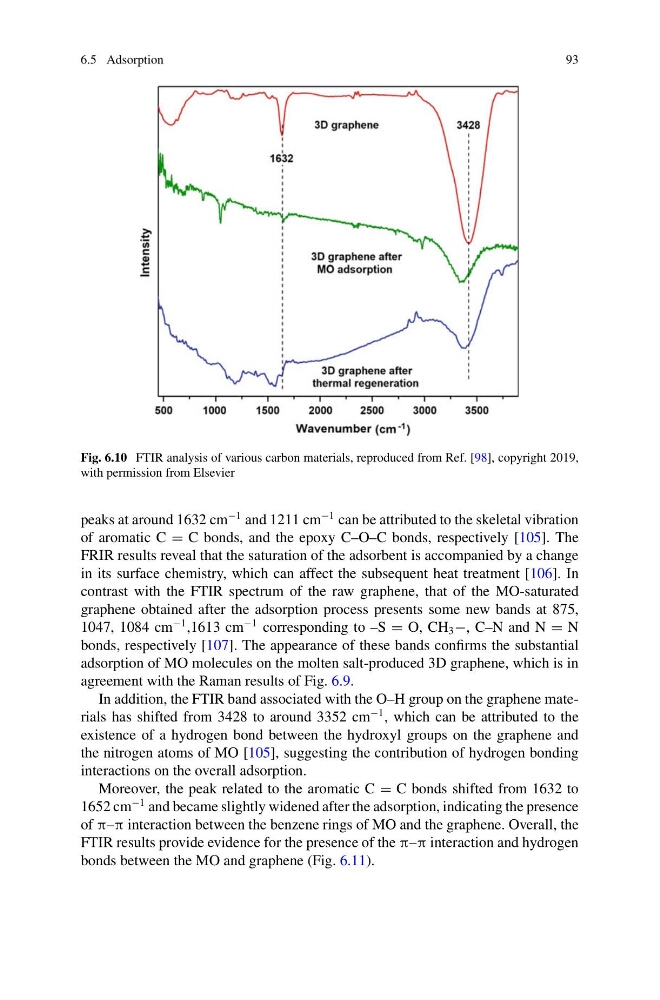
Fig. 6.10 FTIR analysis of various carbon materials, reproduced from Ref. [98], copyright 2019,
with permission from Elsevier
peaks at around 1632 cm
−1 and 1211 cm
−1 can be attributed to the skeletal vibration
of aromatic C = C bonds, and the epoxy C–O–C bonds, respectively [105]. The
FRIR results reveal that the saturation of the adsorbent is accompanied by a change
in its surface chemistry, which can affect the subsequent heat treatment [106]. In
contrast with the FTIR spectrum of the raw graphene, that of the MO-saturated
graphene obtained after the adsorption process presents some new bands at 875,
1047, 1084 cm
−1 ,1613 cm
−1 corresponding to –S = O, CH 3 −, C–N and N = N
bonds, respectively [107]. The appearance of these bands confirms the substantial
adsorption of MO molecules on the molten salt-produced 3D graphene, which is in
agreement with the Raman results of Fig. 6.9.
In addition, the FTIR band associated with the O–H group on the graphene materials has shifted from 3428 to around 3352 cm
−1 , which can be attributed to the
existence of a hydrogen bond between the hydroxyl groups on the graphene and
the nitrogen atoms of MO [105], suggesting the contribution of hydrogen bonding
interactions on the overall adsorption.
Moreover, the peak related to the aromatic C = C bonds shifted from 1632 to
1652 cm
−1 and became slightly widened after the adsorption, indicating the presence
of π–π interaction between the benzene rings of MO and the graphene. Overall, the
FTIR results provide evidence for the presence of the π–π interaction and hydrogen
bonds between the MO and graphene (Fig. 6.11).
93
Fig. 6.10 FTIR analysis of various carbon materials, reproduced from Ref. [98], copyright 2019,
with permission from Elsevier
peaks at around 1632 cm
−1 and 1211 cm
−1 can be attributed to the skeletal vibration
of aromatic C = C bonds, and the epoxy C–O–C bonds, respectively [105]. The
FRIR results reveal that the saturation of the adsorbent is accompanied by a change
in its surface chemistry, which can affect the subsequent heat treatment [106]. In
contrast with the FTIR spectrum of the raw graphene, that of the MO-saturated
graphene obtained after the adsorption process presents some new bands at 875,
1047, 1084 cm
−1 ,1613 cm
−1 corresponding to –S = O, CH 3 −, C–N and N = N
bonds, respectively [107]. The appearance of these bands confirms the substantial
adsorption of MO molecules on the molten salt-produced 3D graphene, which is in
agreement with the Raman results of Fig. 6.9.
In addition, the FTIR band associated with the O–H group on the graphene materials has shifted from 3428 to around 3352 cm
−1 , which can be attributed to the
existence of a hydrogen bond between the hydroxyl groups on the graphene and
the nitrogen atoms of MO [105], suggesting the contribution of hydrogen bonding
interactions on the overall adsorption.
Moreover, the peak related to the aromatic C = C bonds shifted from 1632 to
1652 cm
−1 and became slightly widened after the adsorption, indicating the presence
of π–π interaction between the benzene rings of MO and the graphene. Overall, the
FTIR results provide evidence for the presence of the π–π interaction and hydrogen
bonds between the MO and graphene (Fig. 6.11).