

92
6 Applications of Carbon Nanostructures Produced in Molten Salts
It should be mentioned that the fast and convenient detection of dye species in
the aqueous solutions is either scientifically and commercially valuable from an
environmental point of view. Wu el al. [101] reported that Ag-coated SiO 2 spheres
can be used as a surface-enhanced Raman scattering substrate (SERS) to enhance
Raman scattering signals of organic dyes, including methyl red, methyl orange,
brilliant green and methylene blue. The SERS substrate coated with methyl orange
exhibited several peaks including a characteristic peak at 1141 cm
−1 , attributed to
the deformation vibration of the aromatic C–C bonds.
Figure 6.9c shows the surface-enhanced Raman spectrum of MO adsorbed on the
3D graphene produced in molten salts. On the other hand, these MO-related Raman
peaks disappeared after the thermal regeneration at 300 °C, confirming the removal
of MO, as can be observed from Fig. 6.9d.
The Raman spectra of Fig. 6.9 can be used to evaluate the quality of the raw
and regenerated graphene nanosheets, considering that the 2D band configuration in
graphitic materials is sensitive to the number of carbon layers in their flakes. The
2D peak in bulk graphite is asymmetric consisting of two components, while the
monolayer graphene possesses a single and sharp 2D band. The sharp and uniform
2D band of the molten salt-produced 3D graphene represents the Raman features of
single- or few-layered graphene [102], with an I D /I G value of 0.105. A summary of
the structural properties of the graphite and 3D graphene material, as well as those of
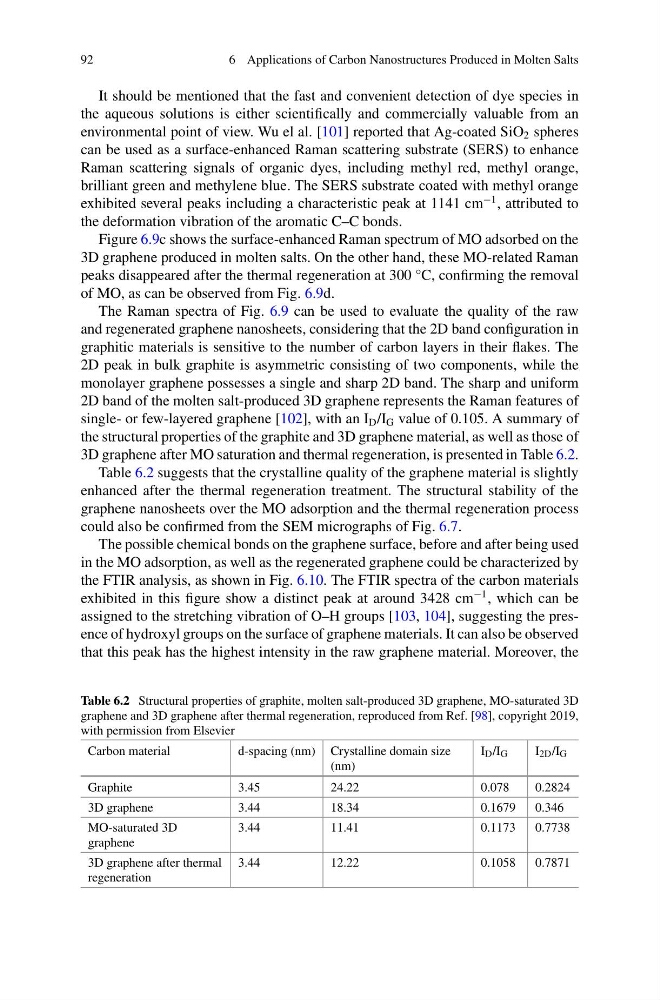
3D graphene after MO saturation and thermal regeneration, is presented in Table 6.2.
Table 6.2 suggests that the crystalline quality of the graphene material is slightly
enhanced after the thermal regeneration treatment. The structural stability of the
graphene nanosheets over the MO adsorption and the thermal regeneration process
could also be confirmed from the SEM micrographs of Fig. 6.7.
The possible chemical bonds on the graphene surface, before and after being used
in the MO adsorption, as well as the regenerated graphene could be characterized by
the FTIR analysis, as shown in Fig. 6.10. The FTIR spectra of the carbon materials
exhibited in this figure show a distinct peak at around 3428 cm
−1 , which can be
assigned to the stretching vibration of O–H groups [103, 104], suggesting the presence of hydroxyl groups on the surface of graphene materials. It can also be observed
that this peak has the highest intensity in the raw graphene material. Moreover, the
Table 6.2 Structural properties of graphite, molten salt-produced 3D graphene, MO-saturated 3D
graphene and 3D graphene after thermal regeneration, reproduced from Ref. [98], copyright 2019,
with permission from Elsevier
Carbon material
d-spacing (nm) Crystalline domain size
(nm)
I D /I G
I 2D /I G
Graphite
3.45
24.22
0.078
0.2824
3D graphene
3.44
18.34
0.1679
0.346
MO-saturated 3D
graphene
3.44
11.41
0.1173
0.7738
3D graphene after thermal
regeneration
3.44
12.22
0.1058
0.7871
6 Applications of Carbon Nanostructures Produced in Molten Salts
It should be mentioned that the fast and convenient detection of dye species in
the aqueous solutions is either scientifically and commercially valuable from an
environmental point of view. Wu el al. [101] reported that Ag-coated SiO 2 spheres
can be used as a surface-enhanced Raman scattering substrate (SERS) to enhance
Raman scattering signals of organic dyes, including methyl red, methyl orange,
brilliant green and methylene blue. The SERS substrate coated with methyl orange
exhibited several peaks including a characteristic peak at 1141 cm
−1 , attributed to
the deformation vibration of the aromatic C–C bonds.
Figure 6.9c shows the surface-enhanced Raman spectrum of MO adsorbed on the
3D graphene produced in molten salts. On the other hand, these MO-related Raman
peaks disappeared after the thermal regeneration at 300 °C, confirming the removal
of MO, as can be observed from Fig. 6.9d.
The Raman spectra of Fig. 6.9 can be used to evaluate the quality of the raw
and regenerated graphene nanosheets, considering that the 2D band configuration in
graphitic materials is sensitive to the number of carbon layers in their flakes. The
2D peak in bulk graphite is asymmetric consisting of two components, while the
monolayer graphene possesses a single and sharp 2D band. The sharp and uniform
2D band of the molten salt-produced 3D graphene represents the Raman features of
single- or few-layered graphene [102], with an I D /I G value of 0.105. A summary of
the structural properties of the graphite and 3D graphene material, as well as those of
3D graphene after MO saturation and thermal regeneration, is presented in Table 6.2.
Table 6.2 suggests that the crystalline quality of the graphene material is slightly
enhanced after the thermal regeneration treatment. The structural stability of the
graphene nanosheets over the MO adsorption and the thermal regeneration process
could also be confirmed from the SEM micrographs of Fig. 6.7.
The possible chemical bonds on the graphene surface, before and after being used
in the MO adsorption, as well as the regenerated graphene could be characterized by
the FTIR analysis, as shown in Fig. 6.10. The FTIR spectra of the carbon materials
exhibited in this figure show a distinct peak at around 3428 cm
−1 , which can be
assigned to the stretching vibration of O–H groups [103, 104], suggesting the presence of hydroxyl groups on the surface of graphene materials. It can also be observed
that this peak has the highest intensity in the raw graphene material. Moreover, the
Table 6.2 Structural properties of graphite, molten salt-produced 3D graphene, MO-saturated 3D
graphene and 3D graphene after thermal regeneration, reproduced from Ref. [98], copyright 2019,
with permission from Elsevier
Carbon material
d-spacing (nm) Crystalline domain size
(nm)
I D /I G
I 2D /I G
Graphite
3.45
24.22
0.078
0.2824
3D graphene
3.44
18.34
0.1679
0.346
MO-saturated 3D
graphene
3.44
11.41
0.1173
0.7738
3D graphene after thermal
regeneration
3.44
12.22
0.1058
0.7871