

6.5 Adsorption
91
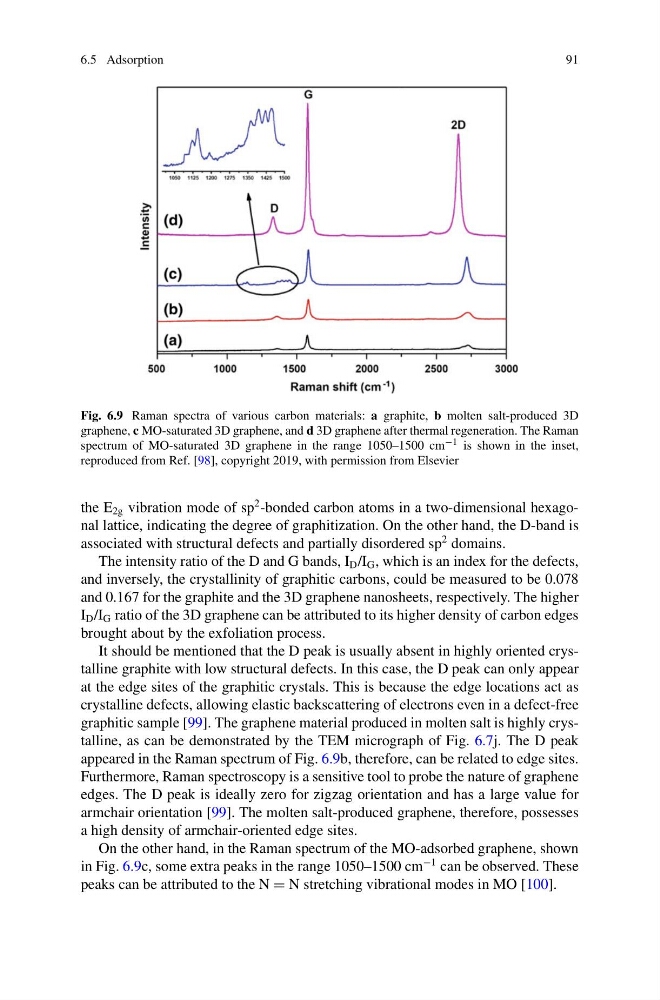
Fig. 6.9 Raman spectra of various carbon materials: a graphite, b molten salt-produced 3D
graphene, c MO-saturated 3D graphene, and d 3D graphene after thermal regeneration. The Raman
spectrum of MO-saturated 3D graphene in the range 1050–1500 cm −1 is shown in the inset,
reproduced from Ref. [98], copyright 2019, with permission from Elsevier
the E 2g vibration mode of sp
2 -bonded carbon atoms in a two-dimensional hexagonal lattice, indicating the degree of graphitization. On the other hand, the D-band is
associated with structural defects and partially disordered sp
2 domains.
The intensity ratio of the D and G bands, I D /I G , which is an index for the defects,
and inversely, the crystallinity of graphitic carbons, could be measured to be 0.078
and 0.167 for the graphite and the 3D graphene nanosheets, respectively. The higher
I D /I G ratio of the 3D graphene can be attributed to its higher density of carbon edges
brought about by the exfoliation process.
It should be mentioned that the D peak is usually absent in highly oriented crystalline graphite with low structural defects. In this case, the D peak can only appear
at the edge sites of the graphitic crystals. This is because the edge locations act as
crystalline defects, allowing elastic backscattering of electrons even in a defect-free
graphitic sample [99]. The graphene material produced in molten salt is highly crystalline, as can be demonstrated by the TEM micrograph of Fig. 6.7j. The D peak
appeared in the Raman spectrum of Fig. 6.9b, therefore, can be related to edge sites.
Furthermore, Raman spectroscopy is a sensitive tool to probe the nature of graphene
edges. The D peak is ideally zero for zigzag orientation and has a large value for
armchair orientation [99]. The molten salt-produced graphene, therefore, possesses
a high density of armchair-oriented edge sites.
On the other hand, in the Raman spectrum of the MO-adsorbed graphene, shown
in Fig. 6.9c, some extra peaks in the range 1050–1500 cm
−1 can be observed. These
peaks can be attributed to the N = N stretching vibrational modes in MO [100].
91
Fig. 6.9 Raman spectra of various carbon materials: a graphite, b molten salt-produced 3D
graphene, c MO-saturated 3D graphene, and d 3D graphene after thermal regeneration. The Raman
spectrum of MO-saturated 3D graphene in the range 1050–1500 cm −1 is shown in the inset,
reproduced from Ref. [98], copyright 2019, with permission from Elsevier
the E 2g vibration mode of sp
2 -bonded carbon atoms in a two-dimensional hexagonal lattice, indicating the degree of graphitization. On the other hand, the D-band is
associated with structural defects and partially disordered sp
2 domains.
The intensity ratio of the D and G bands, I D /I G , which is an index for the defects,
and inversely, the crystallinity of graphitic carbons, could be measured to be 0.078
and 0.167 for the graphite and the 3D graphene nanosheets, respectively. The higher
I D /I G ratio of the 3D graphene can be attributed to its higher density of carbon edges
brought about by the exfoliation process.
It should be mentioned that the D peak is usually absent in highly oriented crystalline graphite with low structural defects. In this case, the D peak can only appear
at the edge sites of the graphitic crystals. This is because the edge locations act as
crystalline defects, allowing elastic backscattering of electrons even in a defect-free
graphitic sample [99]. The graphene material produced in molten salt is highly crystalline, as can be demonstrated by the TEM micrograph of Fig. 6.7j. The D peak
appeared in the Raman spectrum of Fig. 6.9b, therefore, can be related to edge sites.
Furthermore, Raman spectroscopy is a sensitive tool to probe the nature of graphene
edges. The D peak is ideally zero for zigzag orientation and has a large value for
armchair orientation [99]. The molten salt-produced graphene, therefore, possesses
a high density of armchair-oriented edge sites.
On the other hand, in the Raman spectrum of the MO-adsorbed graphene, shown
in Fig. 6.9c, some extra peaks in the range 1050–1500 cm
−1 can be observed. These
peaks can be attributed to the N = N stretching vibrational modes in MO [100].