

1200
2D BFT
Average overall latency
(number of clock cycles)
1000
800
600
400
200
0
Offered load (packets/cycle/IP)
0.002 0.004 0.006 0.008 0.010 0.012 0.014 0.016
3D BFT
2D Mesh-1
3D Mesh-1
2D Mesh-2
3D Mesh-2
2D MoT
3D MoT
0.002
200
0
400
600
800
1000
1200
0.004 0.006 0.008 0.010 0.012 0.014 0.016
Average overall latency
(number of clock cycles)
2D BFT
3D BFT
2D Mesh-1
3D Mesh-1
2D Mesh-2
3D Mesh-2
2D MoT
2D MoT
Offered load (packets/cycle/IP)
343
Three-Dimensional Integration of Network-on-Chip
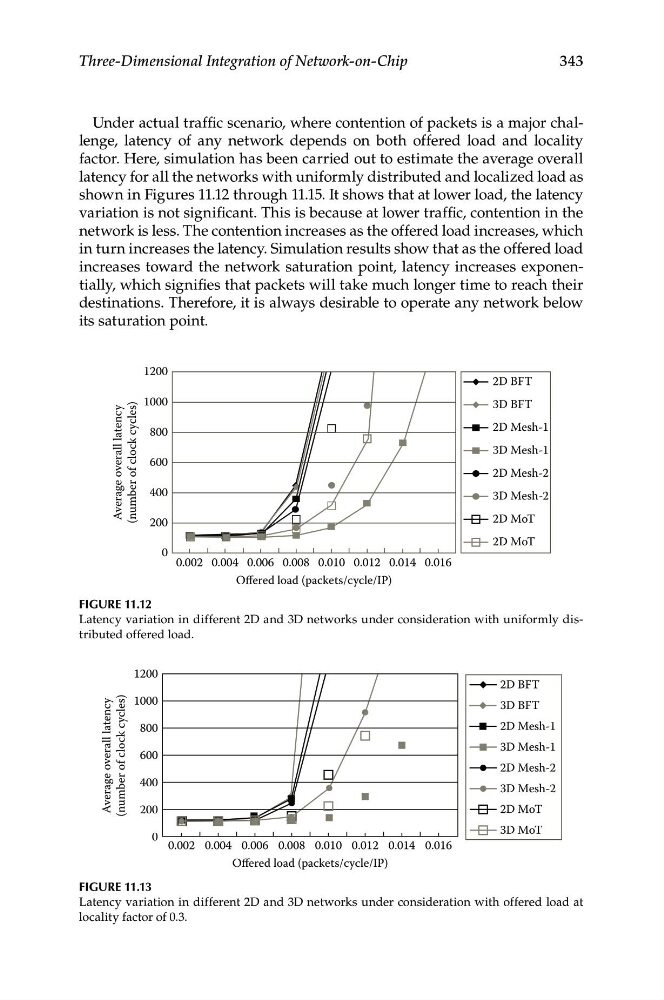
Under actual traffic scenario, where contention of packets is a major challenge, latency of any network depends on both offered load and locality
factor. Here, simulation has been carried out to estimate the average overall
latency for all the networks with uniformly distributed and localized load as
shown in Figures 11.12 through 11.15. It shows that at lower load, the latency
variation is not significant. This is because at lower traffic, contention in the
network is less. The contention increases as the offered load increases, which
in turn increases the latency. Simulation results show that as the offered load
increases toward the network saturation point, latency increases exponentially, which signifies that packets will take much longer time to reach their
destinations. Therefore, it is always desirable to operate any network below
its saturation point.
Figure 11.12
Latency variation in different 2D and 3D networks under consideration with uniformly distributed offered load.
Figure 11.13
Latency variation in different 2D and 3D networks under consideration with offered load at
locality factor of 0.3.
2D BFT
Average overall latency
(number of clock cycles)
1000
800
600
400
200
0
Offered load (packets/cycle/IP)
0.002 0.004 0.006 0.008 0.010 0.012 0.014 0.016
3D BFT
2D Mesh-1
3D Mesh-1
2D Mesh-2
3D Mesh-2
2D MoT
3D MoT
0.002
200
0
400
600
800
1000
1200
0.004 0.006 0.008 0.010 0.012 0.014 0.016
Average overall latency
(number of clock cycles)
2D BFT
3D BFT
2D Mesh-1
3D Mesh-1
2D Mesh-2
3D Mesh-2
2D MoT
2D MoT
Offered load (packets/cycle/IP)
343
Three-Dimensional Integration of Network-on-Chip
Under actual traffic scenario, where contention of packets is a major challenge, latency of any network depends on both offered load and locality
factor. Here, simulation has been carried out to estimate the average overall
latency for all the networks with uniformly distributed and localized load as
shown in Figures 11.12 through 11.15. It shows that at lower load, the latency
variation is not significant. This is because at lower traffic, contention in the
network is less. The contention increases as the offered load increases, which
in turn increases the latency. Simulation results show that as the offered load
increases toward the network saturation point, latency increases exponentially, which signifies that packets will take much longer time to reach their
destinations. Therefore, it is always desirable to operate any network below
its saturation point.
Figure 11.12
Latency variation in different 2D and 3D networks under consideration with uniformly distributed offered load.
Figure 11.13
Latency variation in different 2D and 3D networks under consideration with offered load at
locality factor of 0.3.