

2D BFT
3D BFT
2D Mesh-1
3D Mesh-1
2D Mesh-2
3D Mesh-2
2D MoT
3D MoT
1500
1200
900
600
300
0
Average overall latency
(number of clock cycles)
0.002 0.004 0.006 0.008 0.010 0.012 0.014 0.016 0.018
Offered load (packets/cycle/IP)
1200
1000
Average overall latency
(number of clock cycles)
800
600
400
200
0
2D BFT
2D Mesh-1
3D Mesh-1
2D Mesh-2
3D Mesh-2
2D MoT
3D MoT
3D BFT
0.002 0.004 0.006 0.008 0.010 0.012 0.014 0.016
Offered load (packets/cycle/IP)
344
Network-on-Chip
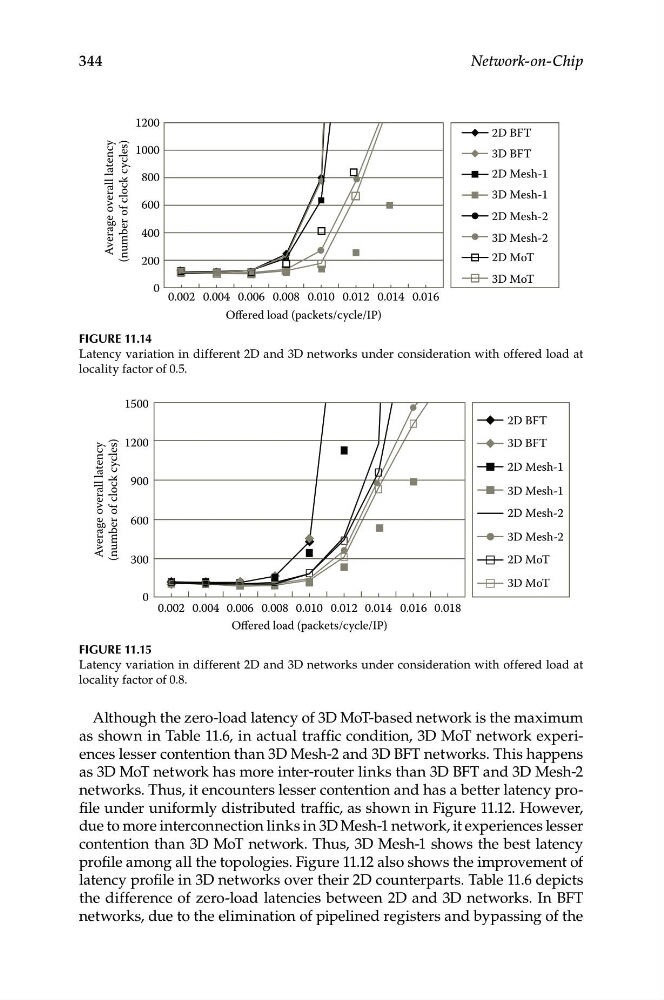
Figure 11.14
Latency variation in different 2D and 3D networks under consideration with offered load at
locality factor of 0.5.
Figure 11.15
Latency variation in different 2D and 3D networks under consideration with offered load at
locality factor of 0.8.
Although the zero-load latency of 3D MoT-based network is the maximum
as shown in Table 11.6, in actual traffic condition, 3D MoT network experiences lesser contention than 3D Mesh-2 and 3D BFT networks. This happens
as 3D MoT network has more inter-router links than 3D BFT and 3D Mesh-2
networks. Thus, it encounters lesser contention and has a better latency profile under uniformly distributed traffic, as shown in Figure 11.12. However,
due to more interconnection links in 3D Mesh-1 network, it experiences lesser
contention than 3D MoT network. Thus, 3D Mesh-1 shows the best latency
profile among all the topologies. Figure 11.12 also shows the improvement of
latency profile in 3D networks over their 2D counterparts. Table 11.6 depicts
the difference of zero-load latencies between 2D and 3D networks. In BFT
networks, due to the elimination of pipelined registers and bypassing of the
3D BFT
2D Mesh-1
3D Mesh-1
2D Mesh-2
3D Mesh-2
2D MoT
3D MoT
1500
1200
900
600
300
0
Average overall latency
(number of clock cycles)
0.002 0.004 0.006 0.008 0.010 0.012 0.014 0.016 0.018
Offered load (packets/cycle/IP)
1200
1000
Average overall latency
(number of clock cycles)
800
600
400
200
0
2D BFT
2D Mesh-1
3D Mesh-1
2D Mesh-2
3D Mesh-2
2D MoT
3D MoT
3D BFT
0.002 0.004 0.006 0.008 0.010 0.012 0.014 0.016
Offered load (packets/cycle/IP)
344
Network-on-Chip
Figure 11.14
Latency variation in different 2D and 3D networks under consideration with offered load at
locality factor of 0.5.
Figure 11.15
Latency variation in different 2D and 3D networks under consideration with offered load at
locality factor of 0.8.
Although the zero-load latency of 3D MoT-based network is the maximum
as shown in Table 11.6, in actual traffic condition, 3D MoT network experiences lesser contention than 3D Mesh-2 and 3D BFT networks. This happens
as 3D MoT network has more inter-router links than 3D BFT and 3D Mesh-2
networks. Thus, it encounters lesser contention and has a better latency profile under uniformly distributed traffic, as shown in Figure 11.12. However,
due to more interconnection links in 3D Mesh-1 network, it experiences lesser
contention than 3D MoT network. Thus, 3D Mesh-1 shows the best latency
profile among all the topologies. Figure 11.12 also shows the improvement of
latency profile in 3D networks over their 2D counterparts. Table 11.6 depicts
the difference of zero-load latencies between 2D and 3D networks. In BFT
networks, due to the elimination of pipelined registers and bypassing of the