

0.40
0.35
Accepted traffic
(flits/cycle/IP)
0.30
0.25
0.20
0.15
0.10
0.05
0.00
3D Mesh-1
3D MoT
3D Mesh-2
3D BFT
0.002
0.004
0.006
0.008
0.010
0.012
0.014
0.016
0.018
0.020
0.022
0.024
0.026
0.028
0.030
Offered load (packets/cycle/Ip)
TABLe 11.5
Throughput Variation with Locality Factor in 2D and 3D Networks
BFT
Mesh-1
Mesh-2
MoT
3D
Locality Factor
2D
3D
2D
3D
2D
3D
2D
0.0
0.3
0.5
0.8
0.25
0.27
0.34
0.43
0.25
0.27
0.34
0.43
0.26
0.30
0.35
0.44
0.38
0.42
0.45
0.54
0.27
0.31
0.35
0.61
0.31
0.37
0.42
0.64
0.29
0.36
0.40
0.65
0.34
0.4
0.45
0.66
341
Three-Dimensional Integration of Network-on-Chip
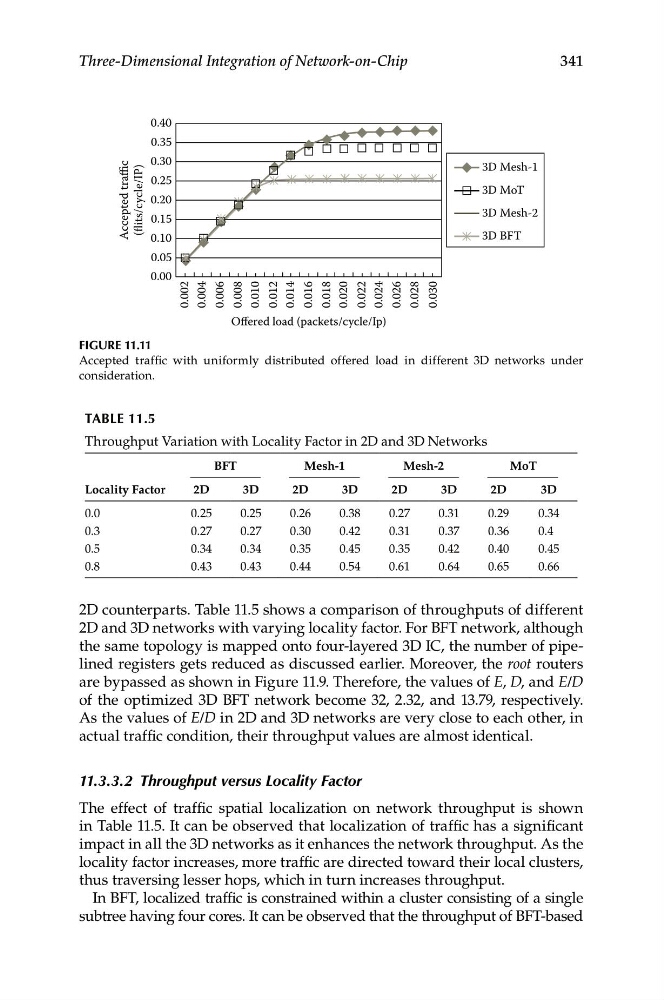
Figure 11.11
Accepted traffic with uniformly distributed offered load in different 3D networks under
consideration.
2D counterparts. Table 11.5 shows a comparison of throughputs of different
2D and 3D networks with varying locality factor. For BFT network, although
the same topology is mapped onto four-layered 3D IC, the number of pipelined registers gets reduced as discussed earlier. Moreover, the root routers
are bypassed as shown in Figure 11.9. Therefore, the values of E, D, and E/D
of the optimized 3D BFT network become 32, 2.32, and 13.79, respectively.
As the values of E/D in 2D and 3D networks are very close to each other, in
actual traffic condition, their throughput values are almost identical.
11.3.3.2 Throughput versus Locality Factor
The effect of traffic spatial localization on network throughput is shown
in Table 11.5. It can be observed that localization of traffic has a significant
impact in all the 3D networks as it enhances the network throughput. As the
locality factor increases, more traffic are directed toward their local clusters,
thus traversing lesser hops, which in turn increases throughput.
In BFT, localized traffic is constrained within a cluster consisting of a single
subtree having four cores. It can be observed that the throughput of BFT-based
0.35
Accepted traffic
(flits/cycle/IP)
0.30
0.25
0.20
0.15
0.10
0.05
0.00
3D Mesh-1
3D MoT
3D Mesh-2
3D BFT
0.002
0.004
0.006
0.008
0.010
0.012
0.014
0.016
0.018
0.020
0.022
0.024
0.026
0.028
0.030
Offered load (packets/cycle/Ip)
TABLe 11.5
Throughput Variation with Locality Factor in 2D and 3D Networks
BFT
Mesh-1
Mesh-2
MoT
3D
Locality Factor
2D
3D
2D
3D
2D
3D
2D
0.0
0.3
0.5
0.8
0.25
0.27
0.34
0.43
0.25
0.27
0.34
0.43
0.26
0.30
0.35
0.44
0.38
0.42
0.45
0.54
0.27
0.31
0.35
0.61
0.31
0.37
0.42
0.64
0.29
0.36
0.40
0.65
0.34
0.4
0.45
0.66
341
Three-Dimensional Integration of Network-on-Chip
Figure 11.11
Accepted traffic with uniformly distributed offered load in different 3D networks under
consideration.
2D counterparts. Table 11.5 shows a comparison of throughputs of different
2D and 3D networks with varying locality factor. For BFT network, although
the same topology is mapped onto four-layered 3D IC, the number of pipelined registers gets reduced as discussed earlier. Moreover, the root routers
are bypassed as shown in Figure 11.9. Therefore, the values of E, D, and E/D
of the optimized 3D BFT network become 32, 2.32, and 13.79, respectively.
As the values of E/D in 2D and 3D networks are very close to each other, in
actual traffic condition, their throughput values are almost identical.
11.3.3.2 Throughput versus Locality Factor
The effect of traffic spatial localization on network throughput is shown
in Table 11.5. It can be observed that localization of traffic has a significant
impact in all the 3D networks as it enhances the network throughput. As the
locality factor increases, more traffic are directed toward their local clusters,
thus traversing lesser hops, which in turn increases throughput.
In BFT, localized traffic is constrained within a cluster consisting of a single
subtree having four cores. It can be observed that the throughput of BFT-based