

0.0
0.3
0
2
4
6
8
Average energy
per packet (nJ)
10
Average energy decreases with
increasing locality factor
0.5
0.8
BFT
Mesh-1
Mesh-2
MoT
Locality factor
113
Evaluation of Network-on-Chip Architectures
Link
Mesh-1
BFT
0
200
400
600
800
1000
1200
1400
1600
Average energy per cycle
(pJ/cycle)
433.1565
578.36106
437.019
930.88818
388.6275
583.35606
468.8445
870.54858
Mesh-2
MoT
Router + repeater
57%
68%
60%
65%
43%
32%
40%
35%
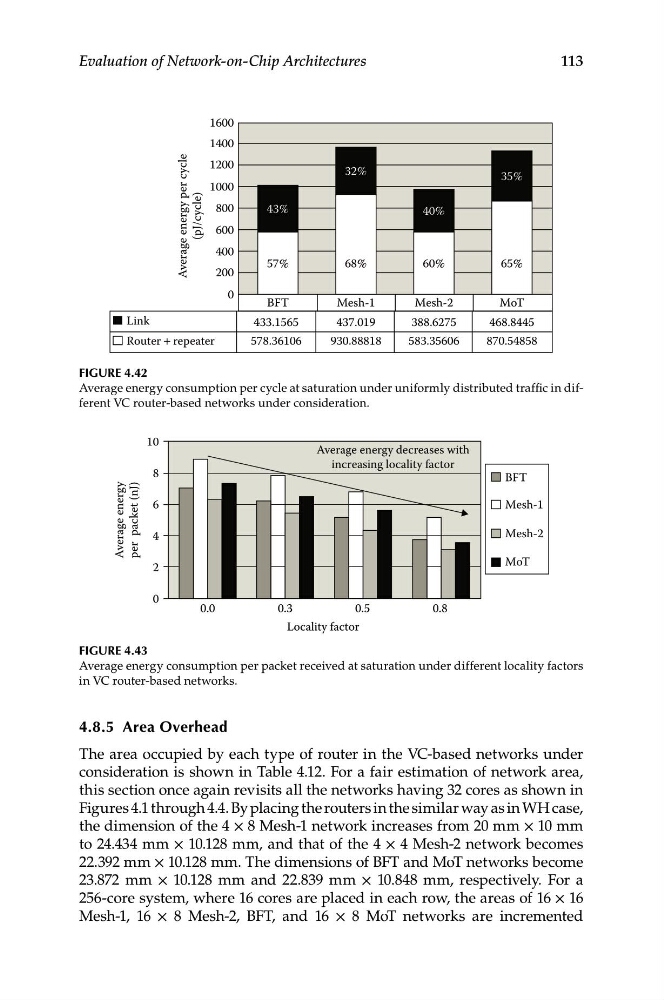
Figure 4.42
Average energy consumption per cycle at saturation under uniformly distributed traffic in different VC router-based networks under consideration.
Figure 4.43
Average energy consumption per packet received at saturation under different locality factors
in VC router-based networks.
4.8.5 Area Overhead
The area occupied by each type of router in the VC-based networks under
consideration is shown in Table 4.12. For a fair estimation of network area,
this section once again revisits all the networks having 32 cores as shown in
Figures 4.1 through 4.4. By placing the routers in the similar way as in WH case,
the dimension of the 4 × 8 Mesh-1 network increases from 20 mm × 10 mm
to 24.434 mm × 10.128 mm, and that of the 4 × 4 Mesh-2 network becomes
22.392 mm × 10.128 mm. The dimensions of BFT and MoT networks become
23.872 mm × 10.128 mm and 22.839 mm × 10.848 mm, respectively. For a
256-core system, where 16 cores are placed in each row, the areas of 16 × 16
Mesh-1, 16 × 8 Mesh-2, BFT, and 16 × 8 MoT networks are incremented
0.3
0
2
4
6
8
Average energy
per packet (nJ)
10
Average energy decreases with
increasing locality factor
0.5
0.8
BFT
Mesh-1
Mesh-2
MoT
Locality factor
113
Evaluation of Network-on-Chip Architectures
Link
Mesh-1
BFT
0
200
400
600
800
1000
1200
1400
1600
Average energy per cycle
(pJ/cycle)
433.1565
578.36106
437.019
930.88818
388.6275
583.35606
468.8445
870.54858
Mesh-2
MoT
Router + repeater
57%
68%
60%
65%
43%
32%
40%
35%
Figure 4.42
Average energy consumption per cycle at saturation under uniformly distributed traffic in different VC router-based networks under consideration.
Figure 4.43
Average energy consumption per packet received at saturation under different locality factors
in VC router-based networks.
4.8.5 Area Overhead
The area occupied by each type of router in the VC-based networks under
consideration is shown in Table 4.12. For a fair estimation of network area,
this section once again revisits all the networks having 32 cores as shown in
Figures 4.1 through 4.4. By placing the routers in the similar way as in WH case,
the dimension of the 4 × 8 Mesh-1 network increases from 20 mm × 10 mm
to 24.434 mm × 10.128 mm, and that of the 4 × 4 Mesh-2 network becomes
22.392 mm × 10.128 mm. The dimensions of BFT and MoT networks become
23.872 mm × 10.128 mm and 22.839 mm × 10.848 mm, respectively. For a
256-core system, where 16 cores are placed in each row, the areas of 16 × 16
Mesh-1, 16 × 8 Mesh-2, BFT, and 16 × 8 MoT networks are incremented