

Before saturation
After saturation
0
200
400
600
800
1000
1200
Average overall latency
(number of clock cycles)
BFT
Mesh-1
Mesh-2
MoT
0.002 0.004 0.006 0.008 0.010 0.012 0.014 0.016 0.018
Offered load (packets/cycle/IP)
112
Network-on-Chip
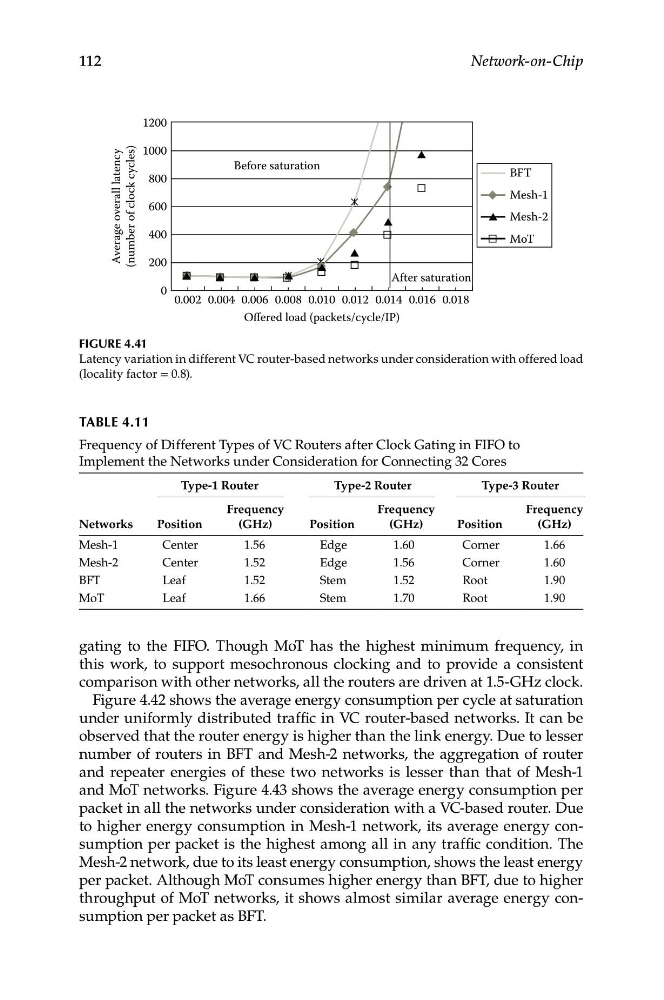
Figure 4.41
Latency variation in different VC router-based networks under consideration with offered load
(locality factor = 0.8).
TABLe 4.11
Frequency of Different Types of VC Routers after Clock Gating in FIFO to
Implement the Networks under Consideration for Connecting 32 Cores
Type-1 Router
Type-2 Router
Type-3 Router
Frequency
Frequency
Frequency
Networks
Position
(GHz)
Position
(GHz)
Position
(GHz)
Mesh-1
Center
1.56
Edge
1.60
Corner
1.66
Mesh-2
Center
1.52
Edge
1.56
Corner
1.60
BFT
Leaf
1.52
Stem
1.52
Root
1.90
MoT
Leaf
1.66
Stem
1.70
Root
1.90
gating to the FIFO. Though MoT has the highest minimum frequency, in
this work, to support mesochronous clocking and to provide a consistent
comparison with other networks, all the routers are driven at 1.5-GHz clock.
Figure 4.42 shows the average energy consumption per cycle at saturation
under uniformly distributed traffic in VC router-based networks. It can be
observed that the router energy is higher than the link energy. Due to lesser
number of routers in BFT and Mesh-2 networks, the aggregation of router
and repeater energies of these two networks is lesser than that of Mesh-1
and MoT networks. Figure 4.43 shows the average energy consumption per
packet in all the networks under consideration with a VC-based router. Due
to higher energy consumption in Mesh-1 network, its average energy consumption per packet is the highest among all in any traffic condition. The
Mesh-2 network, due to its least energy consumption, shows the least energy
per packet. Although MoT consumes higher energy than BFT, due to higher
throughput of MoT networks, it shows almost similar average energy consumption per packet as BFT.
After saturation
0
200
400
600
800
1000
1200
Average overall latency
(number of clock cycles)
BFT
Mesh-1
Mesh-2
MoT
0.002 0.004 0.006 0.008 0.010 0.012 0.014 0.016 0.018
Offered load (packets/cycle/IP)
112
Network-on-Chip
Figure 4.41
Latency variation in different VC router-based networks under consideration with offered load
(locality factor = 0.8).
TABLe 4.11
Frequency of Different Types of VC Routers after Clock Gating in FIFO to
Implement the Networks under Consideration for Connecting 32 Cores
Type-1 Router
Type-2 Router
Type-3 Router
Frequency
Frequency
Frequency
Networks
Position
(GHz)
Position
(GHz)
Position
(GHz)
Mesh-1
Center
1.56
Edge
1.60
Corner
1.66
Mesh-2
Center
1.52
Edge
1.56
Corner
1.60
BFT
Leaf
1.52
Stem
1.52
Root
1.90
MoT
Leaf
1.66
Stem
1.70
Root
1.90
gating to the FIFO. Though MoT has the highest minimum frequency, in
this work, to support mesochronous clocking and to provide a consistent
comparison with other networks, all the routers are driven at 1.5-GHz clock.
Figure 4.42 shows the average energy consumption per cycle at saturation
under uniformly distributed traffic in VC router-based networks. It can be
observed that the router energy is higher than the link energy. Due to lesser
number of routers in BFT and Mesh-2 networks, the aggregation of router
and repeater energies of these two networks is lesser than that of Mesh-1
and MoT networks. Figure 4.43 shows the average energy consumption per
packet in all the networks under consideration with a VC-based router. Due
to higher energy consumption in Mesh-1 network, its average energy consumption per packet is the highest among all in any traffic condition. The
Mesh-2 network, due to its least energy consumption, shows the least energy
per packet. Although MoT consumes higher energy than BFT, due to higher
throughput of MoT networks, it shows almost similar average energy consumption per packet as BFT.