

Before saturation
After saturation
Average overall latency
(number of clock cycles)
0
200
400
600
800
1000
1200
MoT
Mesh-2
Mesh-1
BFT
0.002 0.004 0.006 0.008 0.010 0.012 0.014 0.016
Offered load (packets/cycle/IP)
Before saturation
After saturation
0
200
400
600
800
1000
1200
Average overall latency
(number of clock cycles)
BFT
Mesh-1
Mesh-2
MoT
0.002 0.004 0.006 0.008 0.010 0.012 0.014 0.016
Offered load (packets/cycle/IP)
111
Evaluation of Network-on-Chip Architectures
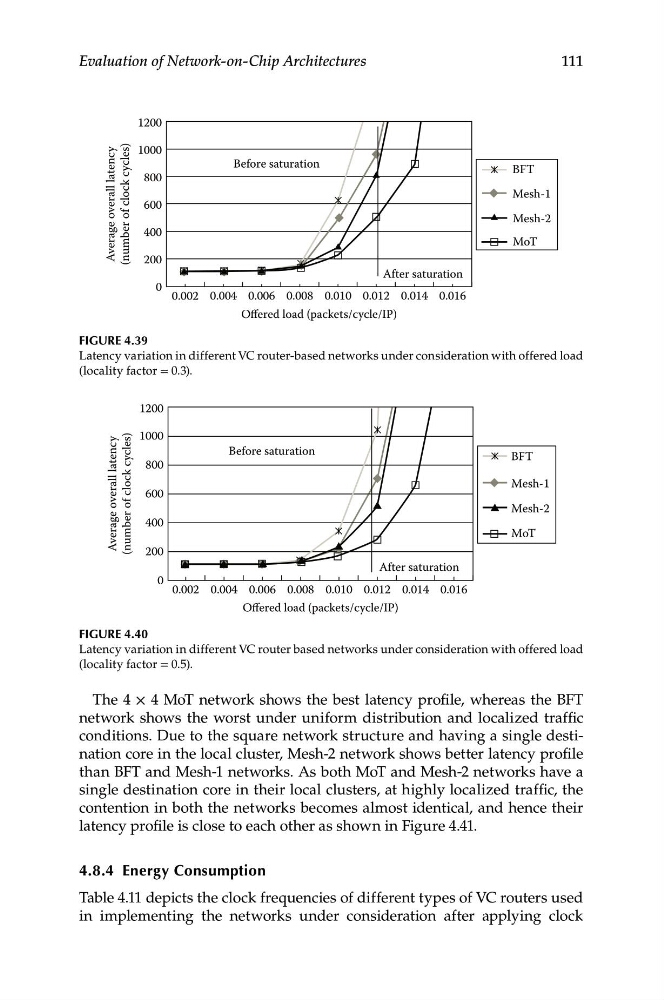
Figure 4.39
Latency variation in different VC router-based networks under consideration with offered load
(locality factor = 0.3).
Figure 4.40
Latency variation in different VC router based networks under consideration with offered load
(locality factor = 0.5).
The 4 × 4 MoT network shows the best latency profile, whereas the BFT
network shows the worst under uniform distribution and localized traffic
conditions. Due to the square network structure and having a single destination core in the local cluster, Mesh-2 network shows better latency profile
than BFT and Mesh-1 networks. As both MoT and Mesh-2 networks have a
single destination core in their local clusters, at highly localized traffic, the
contention in both the networks becomes almost identical, and hence their
latency profile is close to each other as shown in Figure 4.41.
4.8.4 energy Consumption
Table 4.11 depicts the clock frequencies of different types of VC routers used
in implementing the networks under consideration after applying clock