

0.7
0.6
Throughput increases
with locality factor
Throughput
(flits/cycle/IP)
0.5
0.4
0.3
0.2
0.1
0.0
BFT
Mesh-1
Mesh-2
MoT
0.0
0.3
0.5
0.8
Locality factor
Before saturation
Average overall latency
(number of clock cycles)
BFT
Mesh-1
Mesh-2
MoT
After saturation
0.002
0
200
400
600
800
1000
1200
0.004 0.006 0.008 0.010 0.012 0.014
Offered load (packets/cycle/IP)
110
Network-on-Chip
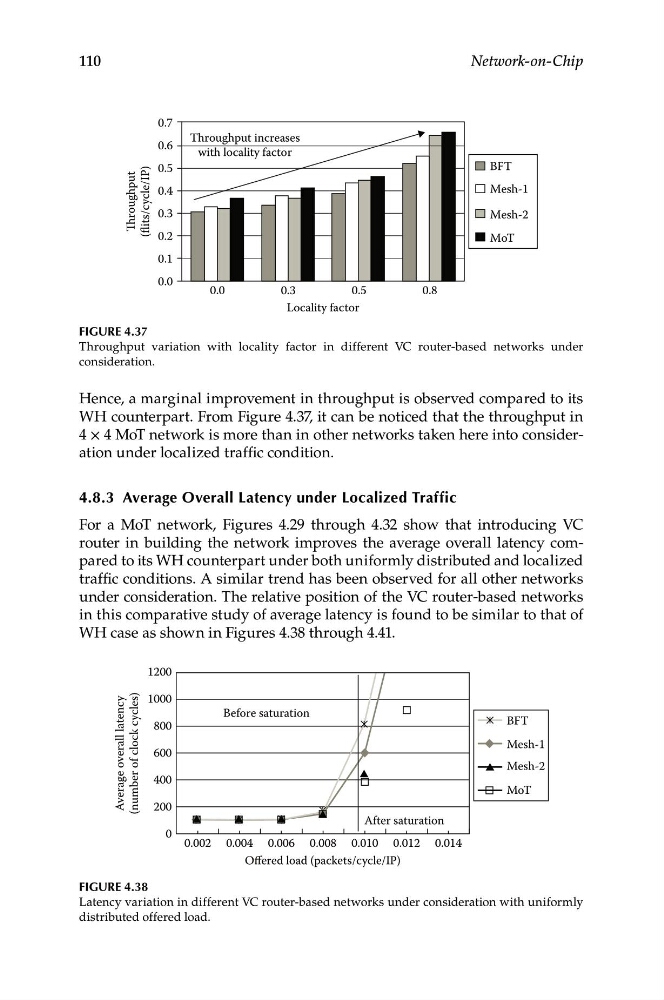
Figure 4.37
Throughput variation with locality factor in different VC router-based networks under
consideration.
Hence, a marginal improvement in throughput is observed compared to its
WH counterpart. From Figure 4.37, it can be noticed that the throughput in
4 × 4 MoT network is more than in other networks taken here into consideration under localized traffic condition.
4.8.3 Average Overall Latency under Localized Traffic
For a MoT network, Figures 4.29 through 4.32 show that introducing VC
router in building the network improves the average overall latency compared to its WH counterpart under both uniformly distributed and localized
traffic conditions. A similar trend has been observed for all other networks
under consideration. The relative position of the VC router-based networks
in this comparative study of average latency is found to be similar to that of
WH case as shown in Figures 4.38 through 4.41.
Figure 4.38
Latency variation in different VC router-based networks under consideration with uniformly
distributed offered load.