

0.40 Before saturation
0.35
d traffic
ycle/IP)
0.30
0.25
0.20
pte
e
s/c
c
c
0.15
A
(flit
After saturation
0.10
0.05
0.00
BFT
Mesh-1
Mesh-2
MoT
0.002
0.004
0.006
0.008
0.010
0.012
0.014
0.016
0.018
0.020
0.022
0.024
0.026
0.028
0.030
Offered load (packets/cycle/IP)
109
Evaluation of Network-on-Chip Architectures
contribute to increase the breadth of the chip, whereas the length of the chip
gets increased due to the routers and repeaters of the row tree. Table 4.10
depicts the total area of the hand layouts and area overheads due to underlying networks for 32- and 256-core-based systems.
4.8 Performance and Cost Comparison of MoT with Other
NoC Structures Having VC Router
4.8.1 Accepted Traffic versus Offered Load
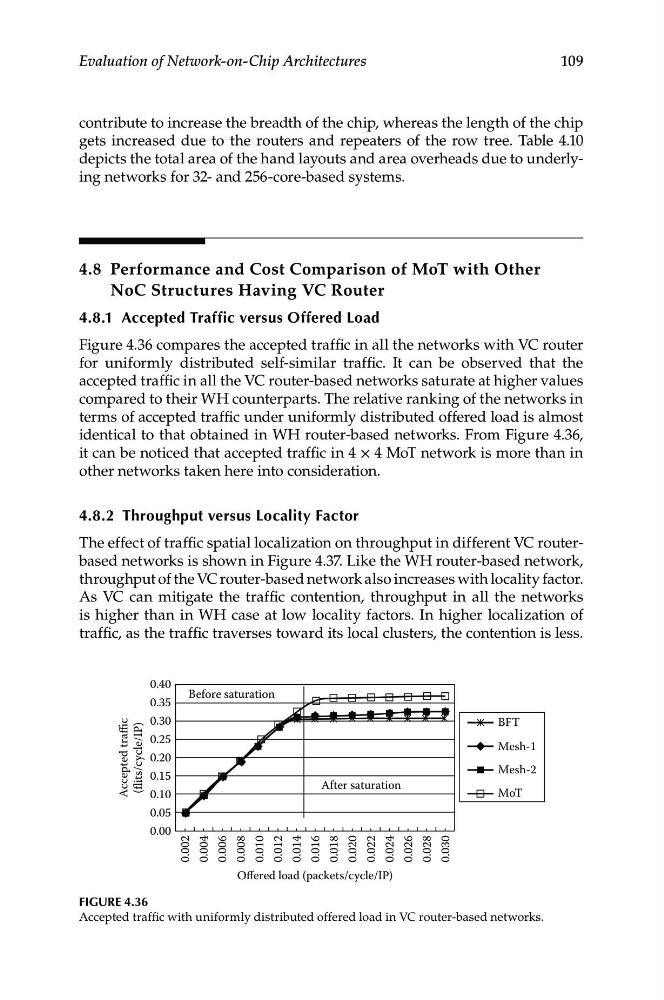
Figure 4.36 compares the accepted traffic in all the networks with VC router
for uniformly distributed self-similar traffic. It can be observed that the
accepted traffic in all the VC router-based networks saturate at higher values
compared to their WH counterparts. The relative ranking of the networks in
terms of accepted traffic under uniformly distributed offered load is almost
identical to that obtained in WH router-based networks. From Figure 4.36,
it can be noticed that accepted traffic in 4 × 4 MoT network is more than in
other networks taken here into consideration.
4.8.2 Throughput versus Locality Factor
The effect of traffic spatial localization on throughput in different VC routerbased networks is shown in Figure 4.37. Like the WH router-based network,
throughput of the VC router-based network also increases with locality factor.
As VC can mitigate the traffic contention, throughput in all the networks
is higher than in WH case at low locality factors. In higher localization of
traffic, as the traffic traverses toward its local clusters, the contention is less.
Figure 4.36
Accepted traffic with uniformly distributed offered load in VC router-based networks.