

1200
0
200
400
600
800
1000
WH
VC
Average overall latency
(number of clock cycles)
0.002 0.004 0.006 0.008 0.010 0.012 0.014 0.016
Offered load (packets/cycle/IP)
0
200
400
600
800
1000
1200
Average overall latency
(number of clock cycles)
WH
VC
0.002 0.004 0.006 0.008 0.010 0.012 0.014 0.016
Offered load (packets/cycle/IP)
106
Network-on-Chip
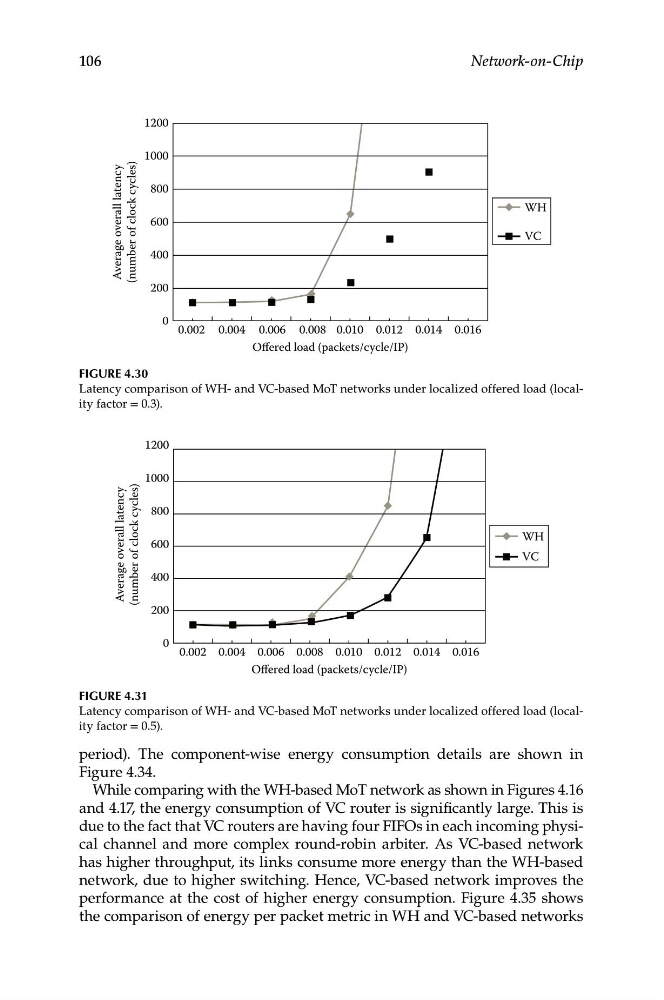
Figure 4.30
Latency comparison of WH- and VC-based MoT networks under localized offered load (locality factor = 0.3).
Figure 4.31
Latency comparison of WH- and VC-based MoT networks under localized offered load (locality factor = 0.5).
period). The component-wise energy consumption details are shown in
Figure 4.34.
While comparing with the WH-based MoT network as shown in Figures 4.16
and 4.17, the energy consumption of VC router is significantly large. This is
due to the fact that VC routers are having four FIFOs in each incoming physical channel and more complex round-robin arbiter. As VC-based network
has higher throughput, its links consume more energy than the WH-based
network, due to higher switching. Hence, VC-based network improves the
performance at the cost of higher energy consumption. Figure 4.35 shows
the comparison of energy per packet metric in WH and VC-based networks