

0.7
0.6
Throughput
(flits/cycle/IP)
0.5
0.4
0.3
0.2
0.1
0.0
0.0
0.3
0.5
Locality factor
0.8
WH
VC
1200
1000
Average overall latency
(number of clock cycles)
800
600
400
200
0 0.002 0.004 0.006 0.008 0.010 0.012 0.014
Offered load (packets/cycle/IP)
WH
VC
105
Evaluation of Network-on-Chip Architectures
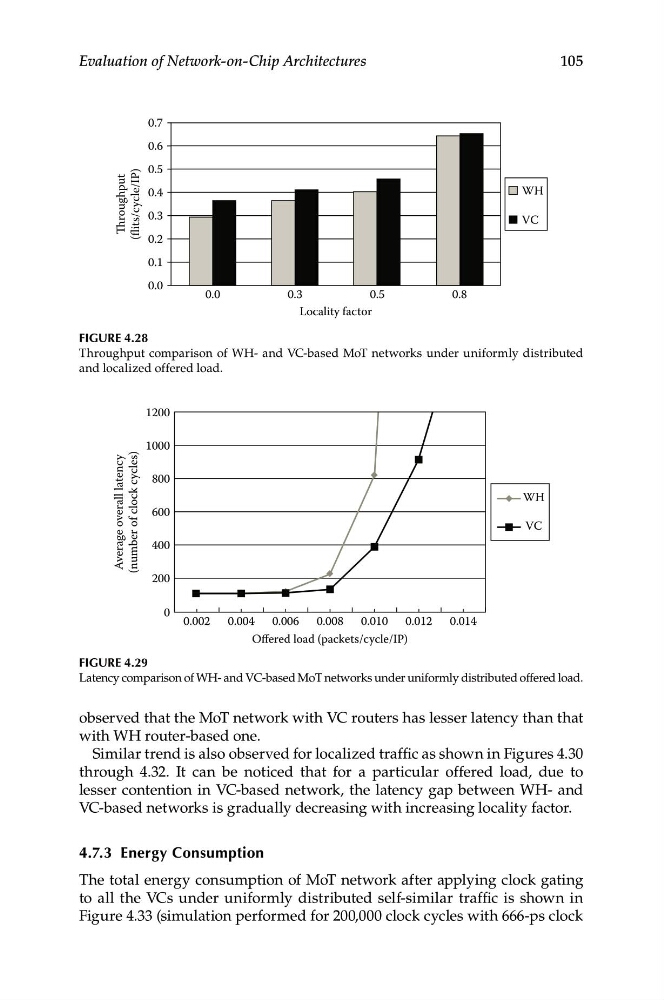
Figure 4.28
Throughput comparison of WH- and VC-based MoT networks under uniformly distributed
and localized offered load.
Figure 4.29
Latency comparison of WH- and VC-based MoT networks under uniformly distributed offered load.
observed that the MoT network with VC routers has lesser latency than that
with WH router-based one.
Similar trend is also observed for localized traffic as shown in Figures 4.30
through 4.32. It can be noticed that for a particular offered load, due to
lesser contention in VC-based network, the latency gap between WH- and
VC-based networks is gradually decreasing with increasing locality factor.
4.7.3 energy Consumption
The total energy consumption of MoT network after applying clock gating
to all the VCs under uniformly distributed self-similar traffic is shown in
Figure 4.33 (simulation performed for 200,000 clock cycles with 666-ps clock
0.6
Throughput
(flits/cycle/IP)
0.5
0.4
0.3
0.2
0.1
0.0
0.0
0.3
0.5
Locality factor
0.8
WH
VC
1200
1000
Average overall latency
(number of clock cycles)
800
600
400
200
0 0.002 0.004 0.006 0.008 0.010 0.012 0.014
Offered load (packets/cycle/IP)
WH
VC
105
Evaluation of Network-on-Chip Architectures
Figure 4.28
Throughput comparison of WH- and VC-based MoT networks under uniformly distributed
and localized offered load.
Figure 4.29
Latency comparison of WH- and VC-based MoT networks under uniformly distributed offered load.
observed that the MoT network with VC routers has lesser latency than that
with WH router-based one.
Similar trend is also observed for localized traffic as shown in Figures 4.30
through 4.32. It can be noticed that for a particular offered load, due to
lesser contention in VC-based network, the latency gap between WH- and
VC-based networks is gradually decreasing with increasing locality factor.
4.7.3 energy Consumption
The total energy consumption of MoT network after applying clock gating
to all the VCs under uniformly distributed self-similar traffic is shown in
Figure 4.33 (simulation performed for 200,000 clock cycles with 666-ps clock