

0 . 0 0 2
0 . 0 0 4
0 . 0 0 6
0 . 0 0 8
0 . 0 1 0
0 . 0 1 2
0 . 0 1 4
0 . 0 1 6
0 . 0 1 8
0 . 0 2 0
0 . 0 2 2
0 . 0 2 4
0 . 0 2 6
0 . 0 2 8
0 . 0 3 0
0.40
0.35
0.30
Accepted traffic
(flits/cycle/IP)
W H
VC
0.25
0.20
0.15
0.10
0.05
0.00
Offered load (p ackets/cycle/IP)
104
Network-on-Chip
every incoming physical channel, at the cost of extra energy consumption
and area overhead. The design of VC router is shown in Chapter 3. This section presents a comparison of performance and cost between the MoT networks with WH and VC routers for a 32-core-based system.
4.7.1 Throughput versus Offered Load
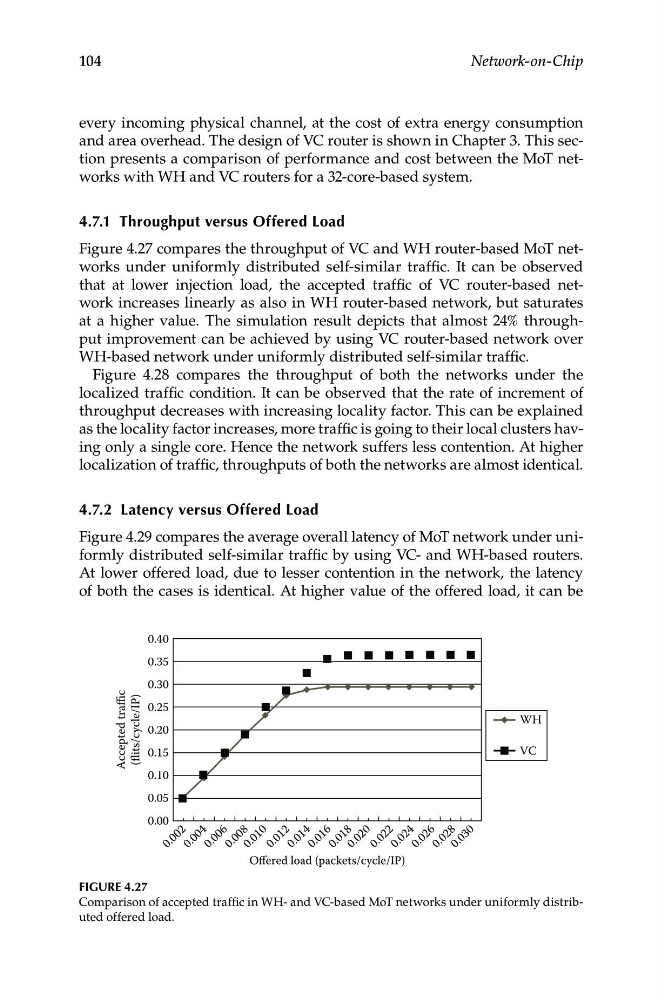
Figure 4.27 compares the throughput of VC and WH router-based MoT networks under uniformly distributed self-similar traffic. It can be observed
that at lower injection load, the accepted traffic of VC router-based network increases linearly as also in WH router-based network, but saturates
at a higher value. The simulation result depicts that almost 24% throughput improvement can be achieved by using VC router-based network over
WH-based network under uniformly distributed self-similar traffic.
Figure 4.28 compares the throughput of both the networks under the
localized traffic condition. It can be observed that the rate of increment of
throughput decreases with increasing locality factor. This can be explained
as the locality factor increases, more traffic is going to their local clusters having only a single core. Hence the network suffers less contention. At higher
localization of traffic, throughputs of both the networks are almost identical.
4.7.2 Latency versus Offered Load
Figure 4.29 compares the average overall latency of MoT network under uniformly distributed self-similar traffic by using VC- and WH-based routers.
At lower offered load, due to lesser contention in the network, the latency
of both the cases is identical. At higher value of the offered load, it can be
Figure 4.27
Comparison of accepted traffic in WH- and VC-based MoT networks under uniformly distributed offered load.
0 . 0 0 4
0 . 0 0 6
0 . 0 0 8
0 . 0 1 0
0 . 0 1 2
0 . 0 1 4
0 . 0 1 6
0 . 0 1 8
0 . 0 2 0
0 . 0 2 2
0 . 0 2 4
0 . 0 2 6
0 . 0 2 8
0 . 0 3 0
0.40
0.35
0.30
Accepted traffic
(flits/cycle/IP)
W H
VC
0.25
0.20
0.15
0.10
0.05
0.00
Offered load (p ackets/cycle/IP)
104
Network-on-Chip
every incoming physical channel, at the cost of extra energy consumption
and area overhead. The design of VC router is shown in Chapter 3. This section presents a comparison of performance and cost between the MoT networks with WH and VC routers for a 32-core-based system.
4.7.1 Throughput versus Offered Load
Figure 4.27 compares the throughput of VC and WH router-based MoT networks under uniformly distributed self-similar traffic. It can be observed
that at lower injection load, the accepted traffic of VC router-based network increases linearly as also in WH router-based network, but saturates
at a higher value. The simulation result depicts that almost 24% throughput improvement can be achieved by using VC router-based network over
WH-based network under uniformly distributed self-similar traffic.
Figure 4.28 compares the throughput of both the networks under the
localized traffic condition. It can be observed that the rate of increment of
throughput decreases with increasing locality factor. This can be explained
as the locality factor increases, more traffic is going to their local clusters having only a single core. Hence the network suffers less contention. At higher
localization of traffic, throughputs of both the networks are almost identical.
4.7.2 Latency versus Offered Load
Figure 4.29 compares the average overall latency of MoT network under uniformly distributed self-similar traffic by using VC- and WH-based routers.
At lower offered load, due to lesser contention in the network, the latency
of both the cases is identical. At higher value of the offered load, it can be
Figure 4.27
Comparison of accepted traffic in WH- and VC-based MoT networks under uniformly distributed offered load.