

Number of Links
Number of
Zero-Load
Few
Networks
Micrometers
1.25 mm
2.5 mm
FIFOs
Latency (cycle)
Mesh-1
24
64
80
136
10
Mesh-2
8
64
64
80
8.45
BFT
0
64
96
80
10
MoT
32
64
80
128
12.32
99
Evaluation of Network-on-Chip Architectures
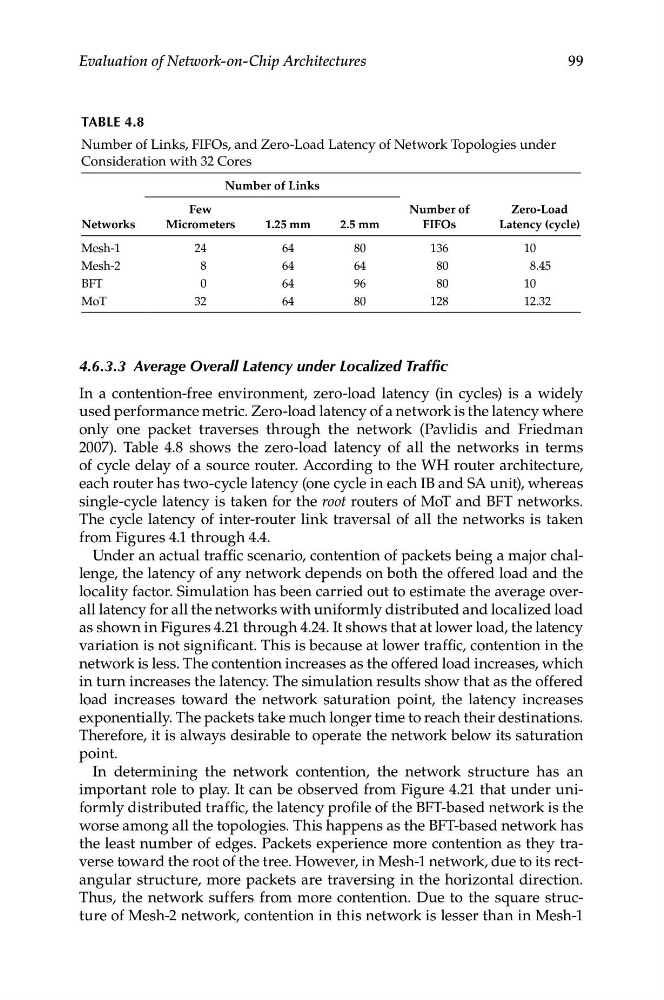
TABLe 4.8
Number of Links, FIFOs, and Zero-Load Latency of Network Topologies under
Consideration with 32 Cores
4.6.3.3 Average Overall Latency under Localized Traffic
In a contention-free environment, zero-load latency (in cycles) is a widely
used performance metric. Zero-load latency of a network is the latency where
only one packet traverses through the network (Pavlidis and Friedman
2007). Table 4.8 shows the zero-load latency of all the networks in terms
of cycle delay of a source router. According to the WH router architecture,
each router has two-cycle latency (one cycle in each IB and SA unit), whereas
single-cycle latency is taken for the root routers of MoT and BFT networks.
The cycle latency of inter-router link traversal of all the networks is taken
from Figures 4.1 through 4.4.
Under an actual traffic scenario, contention of packets being a major challenge, the latency of any network depends on both the offered load and the
locality factor. Simulation has been carried out to estimate the average overall latency for all the networks with uniformly distributed and localized load
as shown in Figures 4.21 through 4.24. It shows that at lower load, the latency
variation is not significant. This is because at lower traffic, contention in the
network is less. The contention increases as the offered load increases, which
in turn increases the latency. The simulation results show that as the offered
load increases toward the network saturation point, the latency increases
exponentially. The packets take much longer time to reach their destinations.
Therefore, it is always desirable to operate the network below its saturation
point.
In determining the network contention, the network structure has an
important role to play. It can be observed from Figure 4.21 that under uniformly distributed traffic, the latency profile of the BFT-based network is the
worse among all the topologies. This happens as the BFT-based network has
the least number of edges. Packets experience more contention as they traverse toward the root of the tree. However, in Mesh-1 network, due to its rectangular structure, more packets are traversing in the horizontal direction.
Thus, the network suffers from more contention. Due to the square structure of Mesh-2 network, contention in this network is lesser than in Mesh-1
Number of
Zero-Load
Few
Networks
Micrometers
1.25 mm
2.5 mm
FIFOs
Latency (cycle)
Mesh-1
24
64
80
136
10
Mesh-2
8
64
64
80
8.45
BFT
0
64
96
80
10
MoT
32
64
80
128
12.32
99
Evaluation of Network-on-Chip Architectures
TABLe 4.8
Number of Links, FIFOs, and Zero-Load Latency of Network Topologies under
Consideration with 32 Cores
4.6.3.3 Average Overall Latency under Localized Traffic
In a contention-free environment, zero-load latency (in cycles) is a widely
used performance metric. Zero-load latency of a network is the latency where
only one packet traverses through the network (Pavlidis and Friedman
2007). Table 4.8 shows the zero-load latency of all the networks in terms
of cycle delay of a source router. According to the WH router architecture,
each router has two-cycle latency (one cycle in each IB and SA unit), whereas
single-cycle latency is taken for the root routers of MoT and BFT networks.
The cycle latency of inter-router link traversal of all the networks is taken
from Figures 4.1 through 4.4.
Under an actual traffic scenario, contention of packets being a major challenge, the latency of any network depends on both the offered load and the
locality factor. Simulation has been carried out to estimate the average overall latency for all the networks with uniformly distributed and localized load
as shown in Figures 4.21 through 4.24. It shows that at lower load, the latency
variation is not significant. This is because at lower traffic, contention in the
network is less. The contention increases as the offered load increases, which
in turn increases the latency. The simulation results show that as the offered
load increases toward the network saturation point, the latency increases
exponentially. The packets take much longer time to reach their destinations.
Therefore, it is always desirable to operate the network below its saturation
point.
In determining the network contention, the network structure has an
important role to play. It can be observed from Figure 4.21 that under uniformly distributed traffic, the latency profile of the BFT-based network is the
worse among all the topologies. This happens as the BFT-based network has
the least number of edges. Packets experience more contention as they traverse toward the root of the tree. However, in Mesh-1 network, due to its rectangular structure, more packets are traversing in the horizontal direction.
Thus, the network suffers from more contention. Due to the square structure of Mesh-2 network, contention in this network is lesser than in Mesh-1