

0.0
0.1
0.2
0.3
0.4
0.5
0.6
0.7
BFT
Mesh-1
Mesh-2
MoT
Th roughput (fl its/cycle/IP)
0.0
0.3
0.5
0.8
Locality factor
98
Network-on-Chip
4.6.3.2 Throughput versus Locality Factor
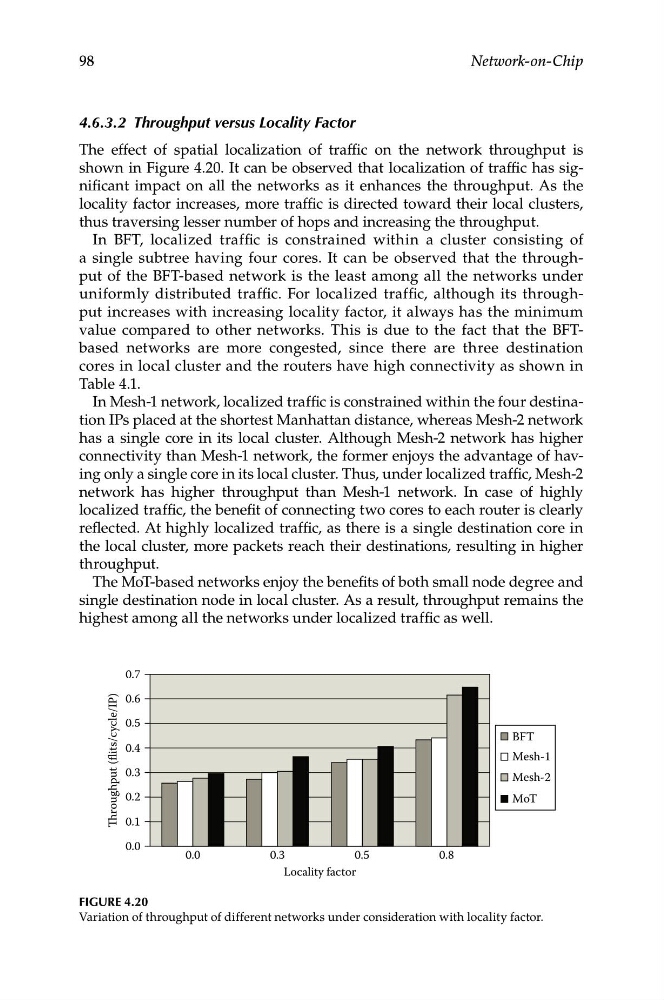
The effect of spatial localization of traffic on the network throughput is
shown in Figure 4.20. It can be observed that localization of traffic has significant impact on all the networks as it enhances the throughput. As the
locality factor increases, more traffic is directed toward their local clusters,
thus traversing lesser number of hops and increasing the throughput.
In BFT, localized traffic is constrained within a cluster consisting of
a single subtree having four cores. It can be observed that the throughput of the BFT-based network is the least among all the networks under
uniformly distributed traffic. For localized traffic, although its throughput increases with increasing locality factor, it always has the minimum
value compared to other networks. This is due to the fact that the BFTbased networks are more congested, since there are three destination
cores in local cluster and the routers have high connectivity as shown in
Table 4.1.
In Mesh-1 network, localized traffic is constrained within the four destination IPs placed at the shortest Manhattan distance, whereas Mesh-2 network
has a single core in its local cluster. Although Mesh-2 network has higher
connectivity than Mesh-1 network, the former enjoys the advantage of having only a single core in its local cluster. Thus, under localized traffic, Mesh-2
network has higher throughput than Mesh-1 network. In case of highly
localized traffic, the benefit of connecting two cores to each router is clearly
reflected. At highly localized traffic, as there is a single destination core in
the local cluster, more packets reach their destinations, resulting in higher
throughput.
The MoT-based networks enjoy the benefits of both small node degree and
single destination node in local cluster. As a result, throughput remains the
highest among all the networks under localized traffic as well.
Figure 4.20
Variation of throughput of different networks under consideration with locality factor.