

586
A. Singhal et al.
0
500
1000
1500
2000
2500
Avidin
only
01:01
02:01
03:01
04:01
05:01
RFU @ 335nm
Biotin/Avidin
Free Biotin
3wj1
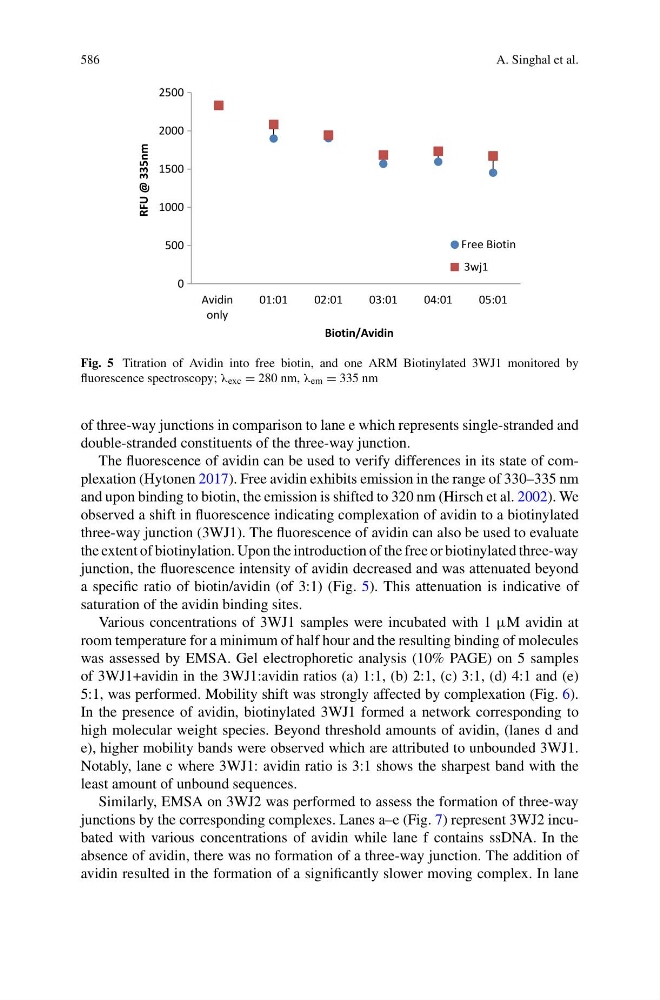
Fig. 5 Titration of Avidin into free biotin, and one ARM Biotinylated 3WJ1 monitored by
fluorescence spectroscopy; λ exc = 280 nm, λ em = 335 nm
of three-way junctions in comparison to lane e which represents single-stranded and
double-stranded constituents of the three-way junction.
The fluorescence of avidin can be used to verify differences in its state of complexation (Hytonen 2017). Free avidin exhibits emission in the range of 330–335 nm
and upon binding to biotin, the emission is shifted to 320 nm (Hirsch et al. 2002). We
observed a shift in fluorescence indicating complexation of avidin to a biotinylated
three-way junction (3WJ1). The fluorescence of avidin can also be used to evaluate
the extent of biotinylation. Upon the introduction of the free or biotinylated three-way
junction, the fluorescence intensity of avidin decreased and was attenuated beyond
a specific ratio of biotin/avidin (of 3:1) (Fig. 5). This attenuation is indicative of
saturation of the avidin binding sites.
Various concentrations of 3WJ1 samples were incubated with 1 μM avidin at
room temperature for a minimum of half hour and the resulting binding of molecules
was assessed by EMSA. Gel electrophoretic analysis (10% PAGE) on 5 samples
of 3WJ1+avidin in the 3WJ1:avidin ratios (a) 1:1, (b) 2:1, (c) 3:1, (d) 4:1 and (e)
5:1, was performed. Mobility shift was strongly affected by complexation (Fig. 6).
In the presence of avidin, biotinylated 3WJ1 formed a network corresponding to
high molecular weight species. Beyond threshold amounts of avidin, (lanes d and
e), higher mobility bands were observed which are attributed to unbounded 3WJ1.
Notably, lane c where 3WJ1: avidin ratio is 3:1 shows the sharpest band with the
least amount of unbound sequences.
Similarly, EMSA on 3WJ2 was performed to assess the formation of three-way
junctions by the corresponding complexes. Lanes a–e (Fig. 7) represent 3WJ2 incubated with various concentrations of avidin while lane f contains ssDNA. In the
absence of avidin, there was no formation of a three-way junction. The addition of
avidin resulted in the formation of a significantly slower moving complex. In lane