

504
P. Joshi et al.
Table 2 Experimentally measured and estimated ZnO thin film parameters
R O2 =
P O2 /(P O2 +
P Ar ) ×
100%
Stress ×
10 9
(dyne/cm 2 )
XRD 2θ
(degree)
XRD 2θ
FWHM
(degree)
Band
gap
(eV)
RMS
roughness
(nm)
FTIR
FWHM
(cm −1 )
30
−2.27
34.49
0.3589
3.192
5.33
20.3
40
−0.06
34.42
0.3607
3.2
4.93
19.4
50
−0.16
34.40
0.37
3.203
4.73
18.3
60
−0.41
34.38
0.3798
3.203
4.61
13.0
is parallel to polar (c-axis) and E 1 is perpendicular (Karthikeyan et al. 2016; Arguello
et al. 1969; McCluskey and Jokela 2009).
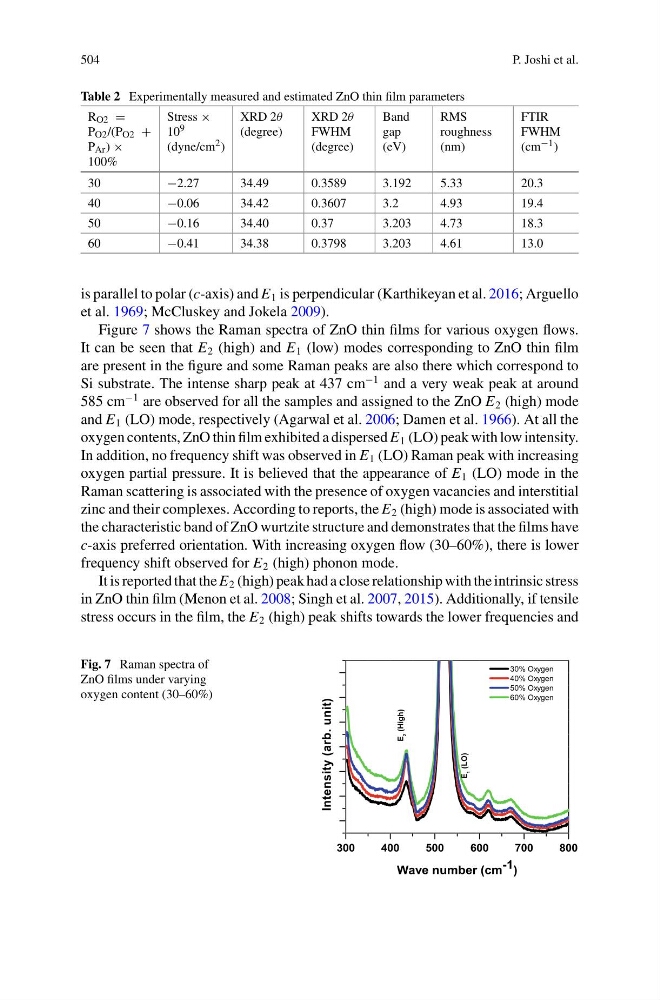
Figure 7 shows the Raman spectra of ZnO thin films for various oxygen flows.
It can be seen that E 2 (high) and E 1 (low) modes corresponding to ZnO thin film
are present in the figure and some Raman peaks are also there which correspond to
Si substrate. The intense sharp peak at 437 cm
−1 and a very weak peak at around
585 cm
−1 are observed for all the samples and assigned to the ZnO E 2 (high) mode
and E 1 (LO) mode, respectively (Agarwal et al. 2006; Damen et al. 1966). At all the
oxygen contents, ZnO thin film exhibited a dispersed E 1 (LO) peak with low intensity.
In addition, no frequency shift was observed in E 1 (LO) Raman peak with increasing
oxygen partial pressure. It is believed that the appearance of E 1 (LO) mode in the
Raman scattering is associated with the presence of oxygen vacancies and interstitial
zinc and their complexes. According to reports, the E 2 (high) mode is associated with
the characteristic band of ZnO wurtzite structure and demonstrates that the films have
c-axis preferred orientation. With increasing oxygen flow (30–60%), there is lower
frequency shift observed for E 2 (high) phonon mode.
It is reported that the E 2 (high) peak had a close relationship with the intrinsic stress
in ZnO thin film (Menon et al. 2008; Singh et al. 2007, 2015). Additionally, if tensile
stress occurs in the film, the E 2 (high) peak shifts towards the lower frequencies and
Fig. 7 Raman spectra of
ZnO films under varying
oxygen content (30–60%)
P. Joshi et al.
Table 2 Experimentally measured and estimated ZnO thin film parameters
R O2 =
P O2 /(P O2 +
P Ar ) ×
100%
Stress ×
10 9
(dyne/cm 2 )
XRD 2θ
(degree)
XRD 2θ
FWHM
(degree)
Band
gap
(eV)
RMS
roughness
(nm)
FTIR
FWHM
(cm −1 )
30
−2.27
34.49
0.3589
3.192
5.33
20.3
40
−0.06
34.42
0.3607
3.2
4.93
19.4
50
−0.16
34.40
0.37
3.203
4.73
18.3
60
−0.41
34.38
0.3798
3.203
4.61
13.0
is parallel to polar (c-axis) and E 1 is perpendicular (Karthikeyan et al. 2016; Arguello
et al. 1969; McCluskey and Jokela 2009).
Figure 7 shows the Raman spectra of ZnO thin films for various oxygen flows.
It can be seen that E 2 (high) and E 1 (low) modes corresponding to ZnO thin film
are present in the figure and some Raman peaks are also there which correspond to
Si substrate. The intense sharp peak at 437 cm
−1 and a very weak peak at around
585 cm
−1 are observed for all the samples and assigned to the ZnO E 2 (high) mode
and E 1 (LO) mode, respectively (Agarwal et al. 2006; Damen et al. 1966). At all the
oxygen contents, ZnO thin film exhibited a dispersed E 1 (LO) peak with low intensity.
In addition, no frequency shift was observed in E 1 (LO) Raman peak with increasing
oxygen partial pressure. It is believed that the appearance of E 1 (LO) mode in the
Raman scattering is associated with the presence of oxygen vacancies and interstitial
zinc and their complexes. According to reports, the E 2 (high) mode is associated with
the characteristic band of ZnO wurtzite structure and demonstrates that the films have
c-axis preferred orientation. With increasing oxygen flow (30–60%), there is lower
frequency shift observed for E 2 (high) phonon mode.
It is reported that the E 2 (high) peak had a close relationship with the intrinsic stress
in ZnO thin film (Menon et al. 2008; Singh et al. 2007, 2015). Additionally, if tensile
stress occurs in the film, the E 2 (high) peak shifts towards the lower frequencies and
Fig. 7 Raman spectra of
ZnO films under varying
oxygen content (30–60%)