

A Comprehensive Characterization of Stress Relaxed ZnO …
505
if compressive stress in the films exists, it shifts to higher frequencies compared to
the bulk value of ZnO E 2 (high) mode (437 cm
−1 ) (Damen et al. 1966; Zhang et al.
2003). Therefore, the Raman result is supported by the X-ray diffraction measurement
results where stress was confirmed by crystal structure.
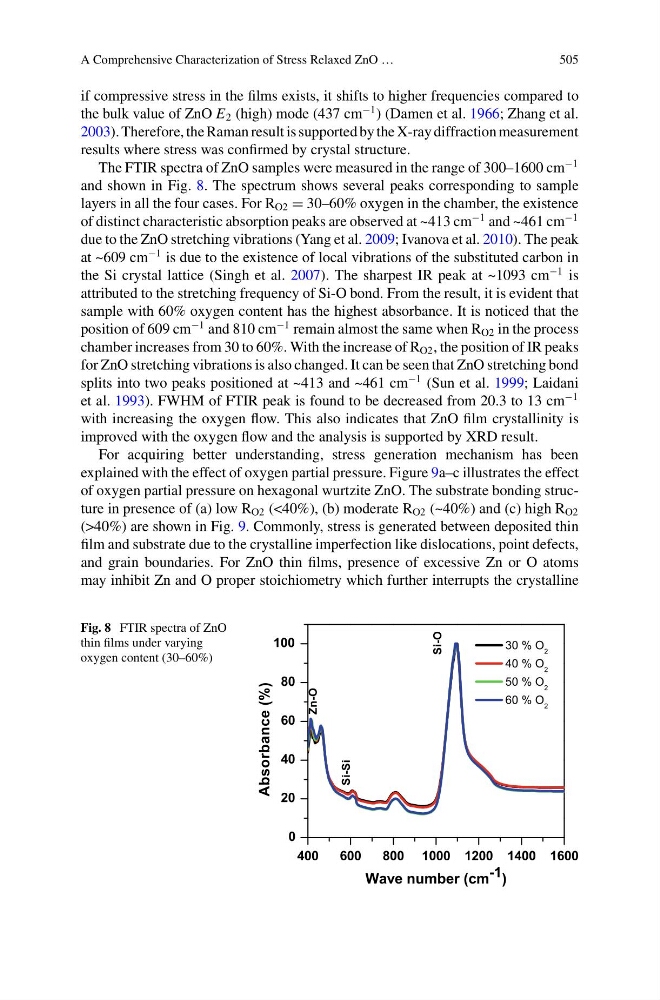
The FTIR spectra of ZnO samples were measured in the range of 300–1600 cm
−1
and shown in Fig. 8. The spectrum shows several peaks corresponding to sample
layers in all the four cases. For R O2 = 30–60% oxygen in the chamber, the existence
of distinct characteristic absorption peaks are observed at ~413 cm
−1 and ~461 cm
−1
due to the ZnO stretching vibrations (Yang et al. 2009; Ivanova et al. 2010). The peak
at ~609 cm
−1 is due to the existence of local vibrations of the substituted carbon in
the Si crystal lattice (Singh et al. 2007). The sharpest IR peak at ~1093 cm
−1 is
attributed to the stretching frequency of Si-O bond. From the result, it is evident that
sample with 60% oxygen content has the highest absorbance. It is noticed that the
position of 609 cm
−1 and 810 cm
−1 remain almost the same when R O2 in the process
chamber increases from 30 to 60%. With the increase of R O2 , the position of IR peaks
for ZnO stretching vibrations is also changed. It can be seen that ZnO stretching bond
splits into two peaks positioned at ~413 and ~461 cm
−1 (Sun et al. 1999; Laidani
et al. 1993). FWHM of FTIR peak is found to be decreased from 20.3 to 13 cm
−1
with increasing the oxygen flow. This also indicates that ZnO film crystallinity is
improved with the oxygen flow and the analysis is supported by XRD result.
For acquiring better understanding, stress generation mechanism has been
explained with the effect of oxygen partial pressure. Figure 9a–c illustrates the effect
of oxygen partial pressure on hexagonal wurtzite ZnO. The substrate bonding structure in presence of (a) low R O2 (<40%), (b) moderate R O2 (~40%) and (c) high R O2
(>40%) are shown in Fig. 9. Commonly, stress is generated between deposited thin
film and substrate due to the crystalline imperfection like dislocations, point defects,
and grain boundaries. For ZnO thin films, presence of excessive Zn or O atoms
may inhibit Zn and O proper stoichiometry which further interrupts the crystalline
Fig. 8 FTIR spectra of ZnO
thin films under varying
oxygen content (30–60%)
505
if compressive stress in the films exists, it shifts to higher frequencies compared to
the bulk value of ZnO E 2 (high) mode (437 cm
−1 ) (Damen et al. 1966; Zhang et al.
2003). Therefore, the Raman result is supported by the X-ray diffraction measurement
results where stress was confirmed by crystal structure.
The FTIR spectra of ZnO samples were measured in the range of 300–1600 cm
−1
and shown in Fig. 8. The spectrum shows several peaks corresponding to sample
layers in all the four cases. For R O2 = 30–60% oxygen in the chamber, the existence
of distinct characteristic absorption peaks are observed at ~413 cm
−1 and ~461 cm
−1
due to the ZnO stretching vibrations (Yang et al. 2009; Ivanova et al. 2010). The peak
at ~609 cm
−1 is due to the existence of local vibrations of the substituted carbon in
the Si crystal lattice (Singh et al. 2007). The sharpest IR peak at ~1093 cm
−1 is
attributed to the stretching frequency of Si-O bond. From the result, it is evident that
sample with 60% oxygen content has the highest absorbance. It is noticed that the
position of 609 cm
−1 and 810 cm
−1 remain almost the same when R O2 in the process
chamber increases from 30 to 60%. With the increase of R O2 , the position of IR peaks
for ZnO stretching vibrations is also changed. It can be seen that ZnO stretching bond
splits into two peaks positioned at ~413 and ~461 cm
−1 (Sun et al. 1999; Laidani
et al. 1993). FWHM of FTIR peak is found to be decreased from 20.3 to 13 cm
−1
with increasing the oxygen flow. This also indicates that ZnO film crystallinity is
improved with the oxygen flow and the analysis is supported by XRD result.
For acquiring better understanding, stress generation mechanism has been
explained with the effect of oxygen partial pressure. Figure 9a–c illustrates the effect
of oxygen partial pressure on hexagonal wurtzite ZnO. The substrate bonding structure in presence of (a) low R O2 (<40%), (b) moderate R O2 (~40%) and (c) high R O2
(>40%) are shown in Fig. 9. Commonly, stress is generated between deposited thin
film and substrate due to the crystalline imperfection like dislocations, point defects,
and grain boundaries. For ZnO thin films, presence of excessive Zn or O atoms
may inhibit Zn and O proper stoichiometry which further interrupts the crystalline
Fig. 8 FTIR spectra of ZnO
thin films under varying
oxygen content (30–60%)