

A Comprehensive Characterization of Stress Relaxed ZnO …
503
(a)
(b)
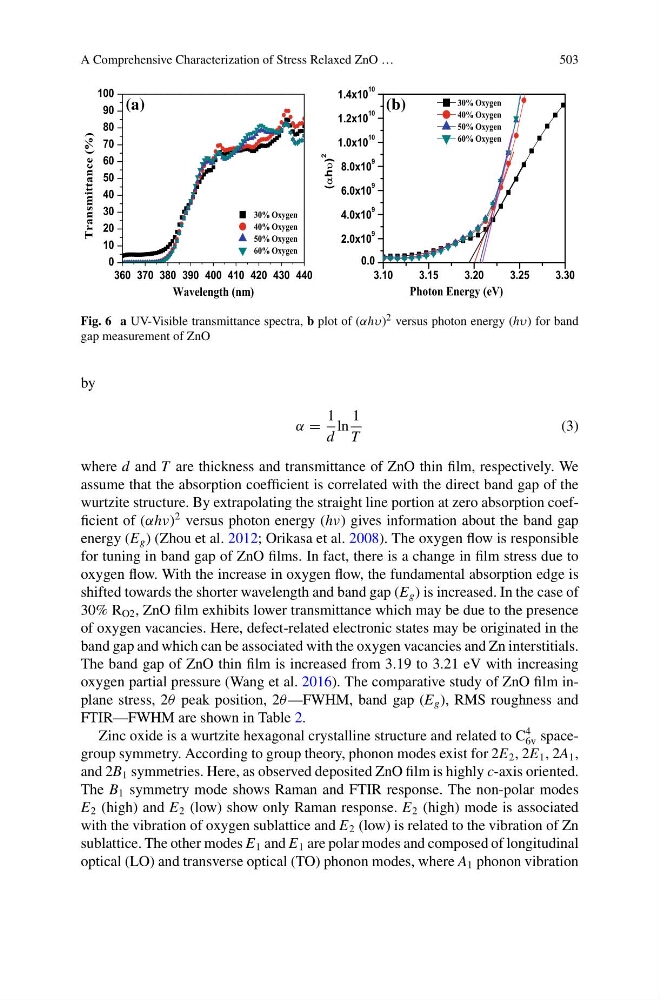
Fig. 6 a UV-Visible transmittance spectra, b plot of (αhυ) 2 versus photon energy (hυ) for band
gap measurement of ZnO
by
α =
1
d
ln
1
T
(3)
where d and T are thickness and transmittance of ZnO thin film, respectively. We
assume that the absorption coefficient is correlated with the direct band gap of the
wurtzite structure. By extrapolating the straight line portion at zero absorption coefficient of (αhν)
2 versus photon energy (hν) gives information about the band gap
energy (E g ) (Zhou et al. 2012; Orikasa et al. 2008). The oxygen flow is responsible
for tuning in band gap of ZnO films. In fact, there is a change in film stress due to
oxygen flow. With the increase in oxygen flow, the fundamental absorption edge is
shifted towards the shorter wavelength and band gap (E g ) is increased. In the case of
30% R O2 , ZnO film exhibits lower transmittance which may be due to the presence
of oxygen vacancies. Here, defect-related electronic states may be originated in the
band gap and which can be associated with the oxygen vacancies and Zn interstitials.
The band gap of ZnO thin film is increased from 3.19 to 3.21 eV with increasing
oxygen partial pressure (Wang et al. 2016). The comparative study of ZnO film inplane stress, 2θ peak position, 2θ —FWHM, band gap (E g ), RMS roughness and
FTIR—FWHM are shown in Table 2.
Zinc oxide is a wurtzite hexagonal crystalline structure and related to C
4
6v spacegroup symmetry. According to group theory, phonon modes exist for 2E 2 , 2E 1 , 2A 1 ,
and 2B 1 symmetries. Here, as observed deposited ZnO film is highly c-axis oriented.
The B 1 symmetry mode shows Raman and FTIR response. The non-polar modes
E 2 (high) and E 2 (low) show only Raman response. E 2 (high) mode is associated
with the vibration of oxygen sublattice and E 2 (low) is related to the vibration of Zn
sublattice. The other modes E 1 and E 1 are polar modes and composed of longitudinal
optical (LO) and transverse optical (TO) phonon modes, where A 1 phonon vibration
503
(a)
(b)
Fig. 6 a UV-Visible transmittance spectra, b plot of (αhυ) 2 versus photon energy (hυ) for band
gap measurement of ZnO
by
α =
1
d
ln
1
T
(3)
where d and T are thickness and transmittance of ZnO thin film, respectively. We
assume that the absorption coefficient is correlated with the direct band gap of the
wurtzite structure. By extrapolating the straight line portion at zero absorption coefficient of (αhν)
2 versus photon energy (hν) gives information about the band gap
energy (E g ) (Zhou et al. 2012; Orikasa et al. 2008). The oxygen flow is responsible
for tuning in band gap of ZnO films. In fact, there is a change in film stress due to
oxygen flow. With the increase in oxygen flow, the fundamental absorption edge is
shifted towards the shorter wavelength and band gap (E g ) is increased. In the case of
30% R O2 , ZnO film exhibits lower transmittance which may be due to the presence
of oxygen vacancies. Here, defect-related electronic states may be originated in the
band gap and which can be associated with the oxygen vacancies and Zn interstitials.
The band gap of ZnO thin film is increased from 3.19 to 3.21 eV with increasing
oxygen partial pressure (Wang et al. 2016). The comparative study of ZnO film inplane stress, 2θ peak position, 2θ —FWHM, band gap (E g ), RMS roughness and
FTIR—FWHM are shown in Table 2.
Zinc oxide is a wurtzite hexagonal crystalline structure and related to C
4
6v spacegroup symmetry. According to group theory, phonon modes exist for 2E 2 , 2E 1 , 2A 1 ,
and 2B 1 symmetries. Here, as observed deposited ZnO film is highly c-axis oriented.
The B 1 symmetry mode shows Raman and FTIR response. The non-polar modes
E 2 (high) and E 2 (low) show only Raman response. E 2 (high) mode is associated
with the vibration of oxygen sublattice and E 2 (low) is related to the vibration of Zn
sublattice. The other modes E 1 and E 1 are polar modes and composed of longitudinal
optical (LO) and transverse optical (TO) phonon modes, where A 1 phonon vibration