

Synthesis of Nanomaterials for Energy Generation …
223
For the nanocomposite specific capacitance was calculated from the CV curves
was 215 F/g at a scan rate of 5 mV/s, 191.10 and 174.5 F/g at 10 and 20 mV/s
scan rates respectively. Results show that with increase in the scan rate, specific
capacitance decreases which indicates that at lower scan rates specific capacitance
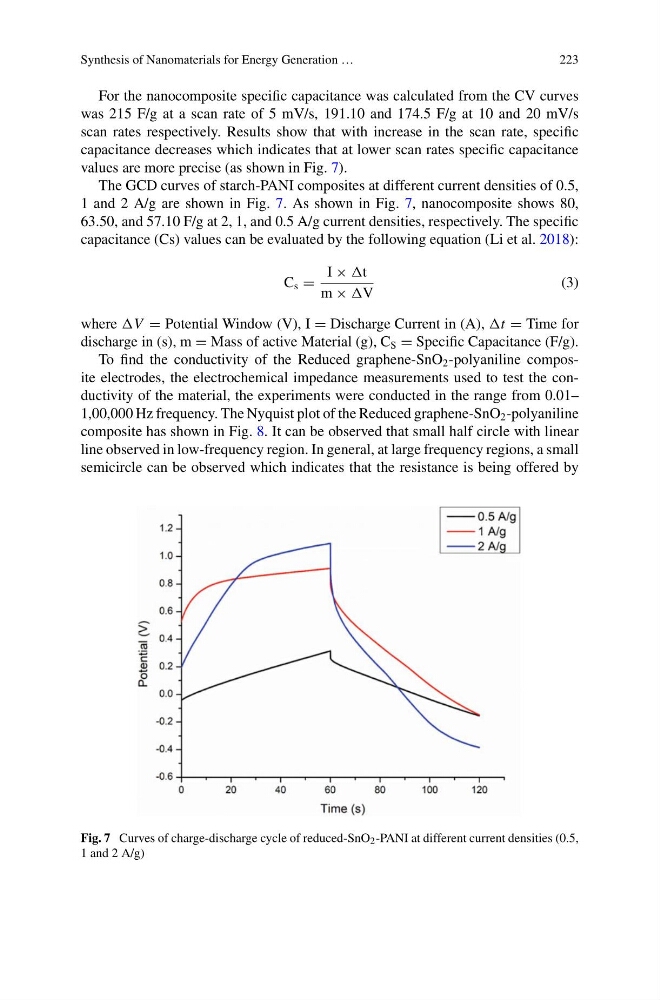
values are more precise (as shown in Fig. 7).
The GCD curves of starch-PANI composites at different current densities of 0.5,
1 and 2 A/g are shown in Fig. 7. As shown in Fig. 7, nanocomposite shows 80,
63.50, and 57.10 F/g at 2, 1, and 0.5 A/g current densities, respectively. The specific
capacitance (Cs) values can be evaluated by the following equation (Li et al. 2018):
C s =
I × t
m × V
(3)
where V = Potential Window (V), I = Discharge Current in (A), t = Time for
discharge in (s), m = Mass of active Material (g), C S = Specific Capacitance (F/g).
To find the conductivity of the Reduced graphene-SnO 2 -polyaniline composite electrodes, the electrochemical impedance measurements used to test the conductivity of the material, the experiments were conducted in the range from 0.01–
1,00,000 Hz frequency. The Nyquist plot of the Reduced graphene-SnO 2 -polyaniline
composite has shown in Fig. 8. It can be observed that small half circle with linear
line observed in low-frequency region. In general, at large frequency regions, a small
semicircle can be observed which indicates that the resistance is being offered by
Fig. 7 Curves of charge-discharge cycle of reduced-SnO 2 -PANI at different current densities (0.5,
1 and 2 A/g)
223
For the nanocomposite specific capacitance was calculated from the CV curves
was 215 F/g at a scan rate of 5 mV/s, 191.10 and 174.5 F/g at 10 and 20 mV/s
scan rates respectively. Results show that with increase in the scan rate, specific
capacitance decreases which indicates that at lower scan rates specific capacitance
values are more precise (as shown in Fig. 7).
The GCD curves of starch-PANI composites at different current densities of 0.5,
1 and 2 A/g are shown in Fig. 7. As shown in Fig. 7, nanocomposite shows 80,
63.50, and 57.10 F/g at 2, 1, and 0.5 A/g current densities, respectively. The specific
capacitance (Cs) values can be evaluated by the following equation (Li et al. 2018):
C s =
I × t
m × V
(3)
where V = Potential Window (V), I = Discharge Current in (A), t = Time for
discharge in (s), m = Mass of active Material (g), C S = Specific Capacitance (F/g).
To find the conductivity of the Reduced graphene-SnO 2 -polyaniline composite electrodes, the electrochemical impedance measurements used to test the conductivity of the material, the experiments were conducted in the range from 0.01–
1,00,000 Hz frequency. The Nyquist plot of the Reduced graphene-SnO 2 -polyaniline
composite has shown in Fig. 8. It can be observed that small half circle with linear
line observed in low-frequency region. In general, at large frequency regions, a small
semicircle can be observed which indicates that the resistance is being offered by
Fig. 7 Curves of charge-discharge cycle of reduced-SnO 2 -PANI at different current densities (0.5,
1 and 2 A/g)