

222
P. Narsimha et al.
Fig. 5 Morphology of synthesized Reduced graphene-SnO 2 -polyaniline composite a 50 nm and
b 10 nm by ultrasound-assisted method
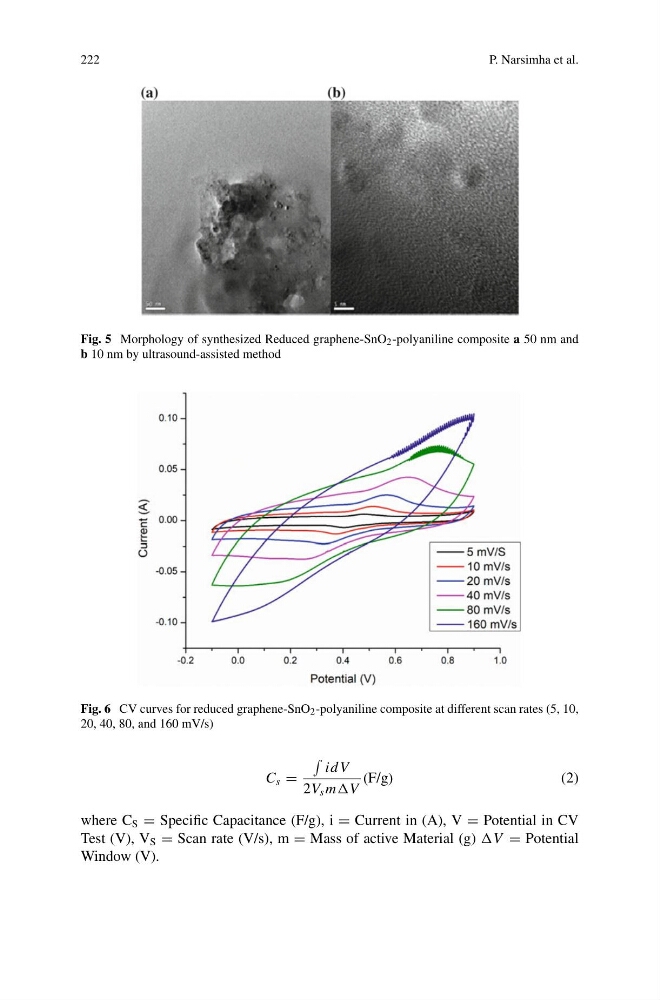
Fig. 6 CV curves for reduced graphene-SnO 2 -polyaniline composite at different scan rates (5, 10,
20, 40, 80, and 160 mV/s)
C s =
idV
2V s mV
(F/g)
(2)
where C S = Specific Capacitance (F/g), i = Current in (A), V = Potential in CV
Test (V), V S = Scan rate (V/s), m = Mass of active Material (g) V = Potential
Window (V).
P. Narsimha et al.
Fig. 5 Morphology of synthesized Reduced graphene-SnO 2 -polyaniline composite a 50 nm and
b 10 nm by ultrasound-assisted method
Fig. 6 CV curves for reduced graphene-SnO 2 -polyaniline composite at different scan rates (5, 10,
20, 40, 80, and 160 mV/s)
C s =
idV
2V s mV
(F/g)
(2)
where C S = Specific Capacitance (F/g), i = Current in (A), V = Potential in CV
Test (V), V S = Scan rate (V/s), m = Mass of active Material (g) V = Potential
Window (V).