

Synthesis of Nanomaterials for Energy Generation …
221
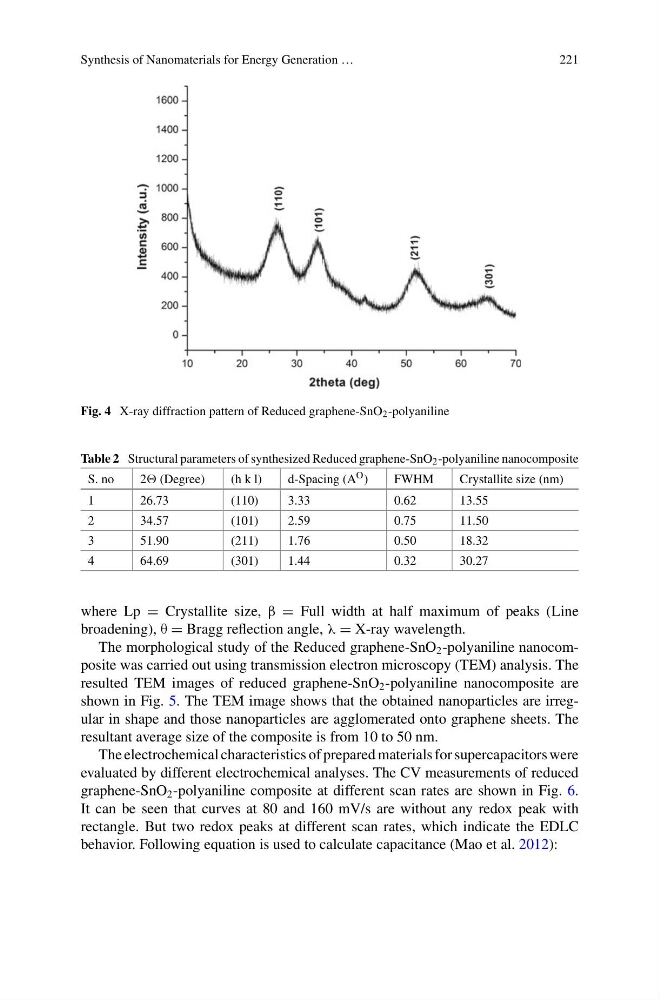
Fig. 4 X-ray diffraction pattern of Reduced graphene-SnO 2 -polyaniline
Table 2 Structural parameters of synthesized Reduced graphene-SnO 2 -polyaniline nanocomposite
S. no
2 (Degree)
(h k l)
d-Spacing (A O )
FWHM
Crystallite size (nm)
1
26.73
(110)
3.33
0.62
13.55
2
34.57
(101)
2.59
0.75
11.50
3
51.90
(211)
1.76
0.50
18.32
4
64.69
(301)
1.44
0.32
30.27
where Lp = Crystallite size, β = Full width at half maximum of peaks (Line
broadening), θ = Bragg reflection angle, λ = X-ray wavelength.
The morphological study of the Reduced graphene-SnO 2 -polyaniline nanocomposite was carried out using transmission electron microscopy (TEM) analysis. The
resulted TEM images of reduced graphene-SnO 2 -polyaniline nanocomposite are
shown in Fig. 5. The TEM image shows that the obtained nanoparticles are irregular in shape and those nanoparticles are agglomerated onto graphene sheets. The
resultant average size of the composite is from 10 to 50 nm.
The electrochemical characteristics of prepared materials for supercapacitors were
evaluated by different electrochemical analyses. The CV measurements of reduced
graphene-SnO 2 -polyaniline composite at different scan rates are shown in Fig. 6.
It can be seen that curves at 80 and 160 mV/s are without any redox peak with
rectangle. But two redox peaks at different scan rates, which indicate the EDLC
behavior. Following equation is used to calculate capacitance (Mao et al. 2012):
221
Fig. 4 X-ray diffraction pattern of Reduced graphene-SnO 2 -polyaniline
Table 2 Structural parameters of synthesized Reduced graphene-SnO 2 -polyaniline nanocomposite
S. no
2 (Degree)
(h k l)
d-Spacing (A O )
FWHM
Crystallite size (nm)
1
26.73
(110)
3.33
0.62
13.55
2
34.57
(101)
2.59
0.75
11.50
3
51.90
(211)
1.76
0.50
18.32
4
64.69
(301)
1.44
0.32
30.27
where Lp = Crystallite size, β = Full width at half maximum of peaks (Line
broadening), θ = Bragg reflection angle, λ = X-ray wavelength.
The morphological study of the Reduced graphene-SnO 2 -polyaniline nanocomposite was carried out using transmission electron microscopy (TEM) analysis. The
resulted TEM images of reduced graphene-SnO 2 -polyaniline nanocomposite are
shown in Fig. 5. The TEM image shows that the obtained nanoparticles are irregular in shape and those nanoparticles are agglomerated onto graphene sheets. The
resultant average size of the composite is from 10 to 50 nm.
The electrochemical characteristics of prepared materials for supercapacitors were
evaluated by different electrochemical analyses. The CV measurements of reduced
graphene-SnO 2 -polyaniline composite at different scan rates are shown in Fig. 6.
It can be seen that curves at 80 and 160 mV/s are without any redox peak with
rectangle. But two redox peaks at different scan rates, which indicate the EDLC
behavior. Following equation is used to calculate capacitance (Mao et al. 2012):