

220
P. Narsimha et al.
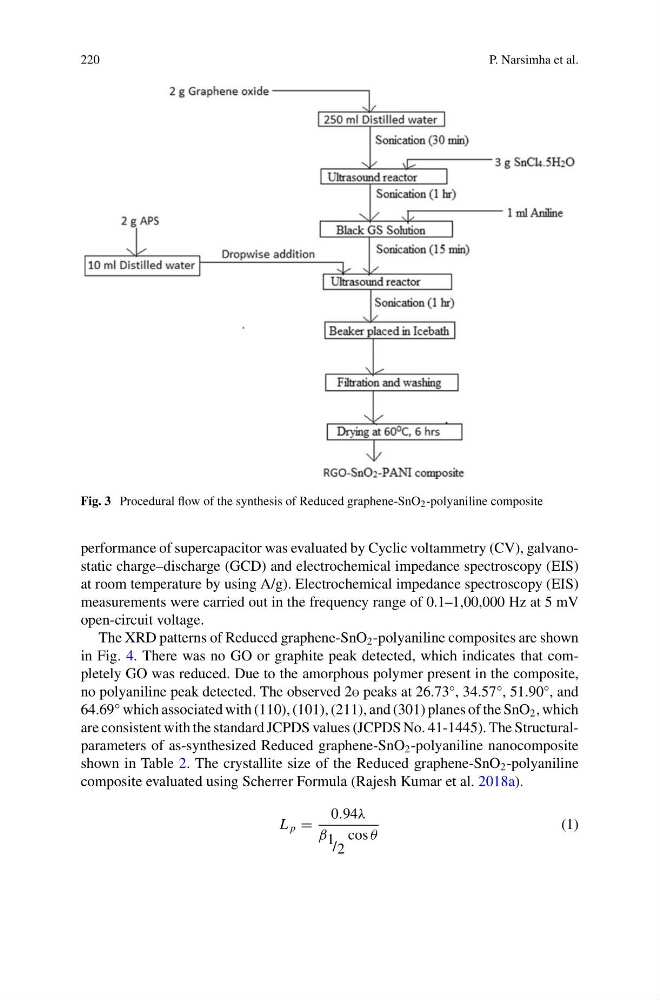
Fig. 3 Procedural flow of the synthesis of Reduced graphene-SnO 2 -polyaniline composite
performance of supercapacitor was evaluated by Cyclic voltammetry (CV), galvanostatic charge–discharge (GCD) and electrochemical impedance spectroscopy (EIS)
at room temperature by using A/g). Electrochemical impedance spectroscopy (EIS)
measurements were carried out in the frequency range of 0.1–1,00,000 Hz at 5 mV
open-circuit voltage.
The XRD patterns of Reduced graphene-SnO 2 -polyaniline composites are shown
in Fig. 4. There was no GO or graphite peak detected, which indicates that completely GO was reduced. Due to the amorphous polymer present in the composite,
no polyaniline peak detected. The observed 28 peaks at 26.73°, 34.57°, 51.90°, and
64.69° which associated with (110), (101), (211), and (301) planes of the SnO 2 , which
are consistent with the standard JCPDS values (JCPDS No. 41-1445). The Structuralparameters of as-synthesized Reduced graphene-SnO 2 -polyaniline nanocomposite
shown in Table 2. The crystallite size of the Reduced graphene-SnO 2 -polyaniline
composite evaluated using Scherrer Formula (Rajesh Kumar et al. 2018a).
L p =
0.94λ
β 1 / 2
cos θ
(1)
P. Narsimha et al.
Fig. 3 Procedural flow of the synthesis of Reduced graphene-SnO 2 -polyaniline composite
performance of supercapacitor was evaluated by Cyclic voltammetry (CV), galvanostatic charge–discharge (GCD) and electrochemical impedance spectroscopy (EIS)
at room temperature by using A/g). Electrochemical impedance spectroscopy (EIS)
measurements were carried out in the frequency range of 0.1–1,00,000 Hz at 5 mV
open-circuit voltage.
The XRD patterns of Reduced graphene-SnO 2 -polyaniline composites are shown
in Fig. 4. There was no GO or graphite peak detected, which indicates that completely GO was reduced. Due to the amorphous polymer present in the composite,
no polyaniline peak detected. The observed 28 peaks at 26.73°, 34.57°, 51.90°, and
64.69° which associated with (110), (101), (211), and (301) planes of the SnO 2 , which
are consistent with the standard JCPDS values (JCPDS No. 41-1445). The Structuralparameters of as-synthesized Reduced graphene-SnO 2 -polyaniline nanocomposite
shown in Table 2. The crystallite size of the Reduced graphene-SnO 2 -polyaniline
composite evaluated using Scherrer Formula (Rajesh Kumar et al. 2018a).
L p =
0.94λ
β 1 / 2
cos θ
(1)