

72
S. Ghosh et al.
2.5.3 Spatially Averaged Mechanical Fields
Both the initial yield strength σ Y and the hardening rate H are computed from the
mean stress and strain fields for each microstructural instantiations with different N p
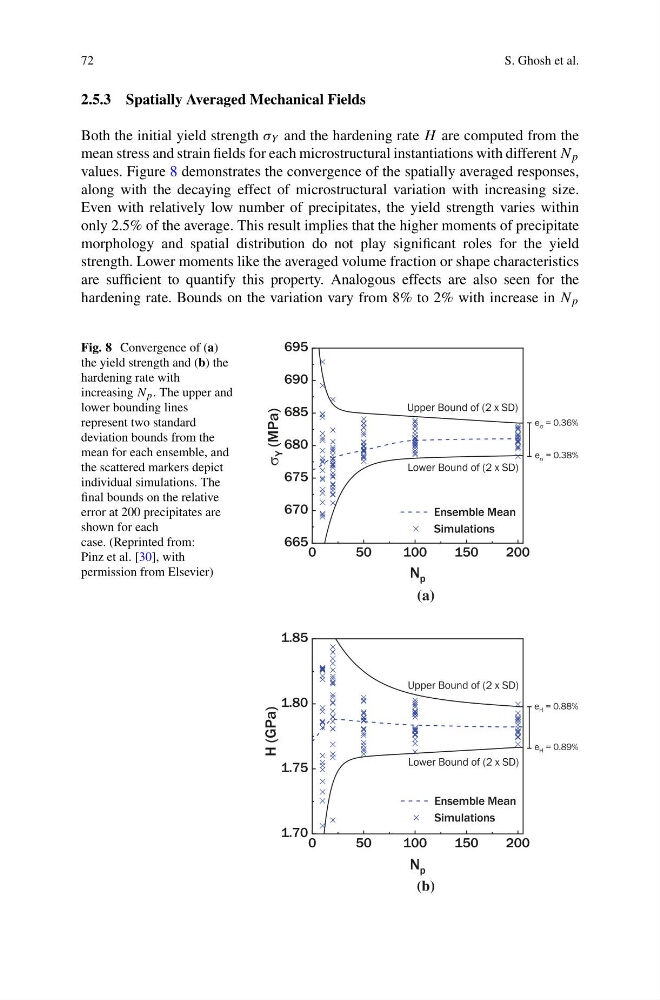
values. Figure 8 demonstrates the convergence of the spatially averaged responses,
along with the decaying effect of microstructural variation with increasing size.
Even with relatively low number of precipitates, the yield strength varies within
only 2.5% of the average. This result implies that the higher moments of precipitate
morphology and spatial distribution do not play significant roles for the yield
strength. Lower moments like the averaged volume fraction or shape characteristics
are sufficient to quantify this property. Analogous effects are also seen for the
hardening rate. Bounds on the variation vary from 8% to 2% with increase in N p
Fig. 8 Convergence of (a)
the yield strength and (b) the
hardening rate with
increasing N p . The upper and
lower bounding lines
represent two standard
deviation bounds from the
mean for each ensemble, and
the scattered markers depict
individual simulations. The
final bounds on the relative
error at 200 precipitates are
shown for each
case. (Reprinted from:
Pinz et al. [30], with
permission from Elsevier)
(a)
(b)
S. Ghosh et al.
2.5.3 Spatially Averaged Mechanical Fields
Both the initial yield strength σ Y and the hardening rate H are computed from the
mean stress and strain fields for each microstructural instantiations with different N p
values. Figure 8 demonstrates the convergence of the spatially averaged responses,
along with the decaying effect of microstructural variation with increasing size.
Even with relatively low number of precipitates, the yield strength varies within
only 2.5% of the average. This result implies that the higher moments of precipitate
morphology and spatial distribution do not play significant roles for the yield
strength. Lower moments like the averaged volume fraction or shape characteristics
are sufficient to quantify this property. Analogous effects are also seen for the
hardening rate. Bounds on the variation vary from 8% to 2% with increase in N p
Fig. 8 Convergence of (a)
the yield strength and (b) the
hardening rate with
increasing N p . The upper and
lower bounding lines
represent two standard
deviation bounds from the
mean for each ensemble, and
the scattered markers depict
individual simulations. The
final bounds on the relative
error at 200 precipitates are
shown for each
case. (Reprinted from:
Pinz et al. [30], with
permission from Elsevier)
(a)
(b)