

M-SERVE and P-SERVE
73
from 10 to 50. As with the yield strength, the hardening rate also converges quickly
with microstructural volume. For both these properties, the P-SERVE is estimated
at N p = 10–20, where the bounding curves fall below 5% relative error.
2.5.4 Local Response Field Variables
Mechanical response fields, obtained from intragranular crystal plasticity simulations, exhibit significant variations in the microstructure consisting of precipitates
and matrix channels. The gradients and extreme values of these fields are often
used as indicators of critical events such as fracture. P-SERVEs that represent the
computational domain for analyses must be sufficient to depict these local features
and gradients. The spatial distribution of three evolving state variables, viz., the
equivalent plastic strain, dislocation density, and stress measures like the von Mises
stress, are studied here for their influence on the estimation of P-SERVEs.
The equivalent plastic strain p :=
2
3 E p : E p , where E p := F pT F p − I and F p
is the plastic deformation gradient, yields a scalar measure of plasticity experienced
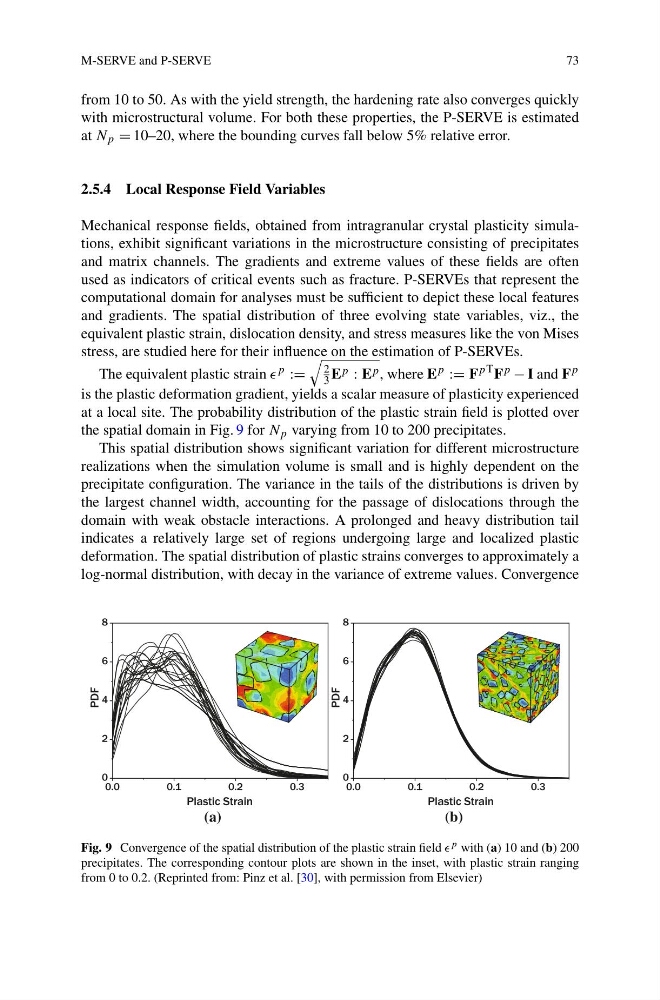
at a local site. The probability distribution of the plastic strain field is plotted over
the spatial domain in Fig. 9 for N p varying from 10 to 200 precipitates.
This spatial distribution shows significant variation for different microstructure
realizations when the simulation volume is small and is highly dependent on the
precipitate configuration. The variance in the tails of the distributions is driven by
the largest channel width, accounting for the passage of dislocations through the
domain with weak obstacle interactions. A prolonged and heavy distribution tail
indicates a relatively large set of regions undergoing large and localized plastic
deformation. The spatial distribution of plastic strains converges to approximately a
log-normal distribution, with decay in the variance of extreme values. Convergence
(a)
(b)
Fig. 9 Convergence of the spatial distribution of the plastic strain field p with (a) 10 and (b) 200
precipitates. The corresponding contour plots are shown in the inset, with plastic strain ranging
from 0 to 0.2. (Reprinted from: Pinz et al. [30], with permission from Elsevier)
73
from 10 to 50. As with the yield strength, the hardening rate also converges quickly
with microstructural volume. For both these properties, the P-SERVE is estimated
at N p = 10–20, where the bounding curves fall below 5% relative error.
2.5.4 Local Response Field Variables
Mechanical response fields, obtained from intragranular crystal plasticity simulations, exhibit significant variations in the microstructure consisting of precipitates
and matrix channels. The gradients and extreme values of these fields are often
used as indicators of critical events such as fracture. P-SERVEs that represent the
computational domain for analyses must be sufficient to depict these local features
and gradients. The spatial distribution of three evolving state variables, viz., the
equivalent plastic strain, dislocation density, and stress measures like the von Mises
stress, are studied here for their influence on the estimation of P-SERVEs.
The equivalent plastic strain p :=
2
3 E p : E p , where E p := F pT F p − I and F p
is the plastic deformation gradient, yields a scalar measure of plasticity experienced
at a local site. The probability distribution of the plastic strain field is plotted over
the spatial domain in Fig. 9 for N p varying from 10 to 200 precipitates.
This spatial distribution shows significant variation for different microstructure
realizations when the simulation volume is small and is highly dependent on the
precipitate configuration. The variance in the tails of the distributions is driven by
the largest channel width, accounting for the passage of dislocations through the
domain with weak obstacle interactions. A prolonged and heavy distribution tail
indicates a relatively large set of regions undergoing large and localized plastic
deformation. The spatial distribution of plastic strains converges to approximately a
log-normal distribution, with decay in the variance of extreme values. Convergence
(a)
(b)
Fig. 9 Convergence of the spatial distribution of the plastic strain field p with (a) 10 and (b) 200
precipitates. The corresponding contour plots are shown in the inset, with plastic strain ranging
from 0 to 0.2. (Reprinted from: Pinz et al. [30], with permission from Elsevier)