

66
S. Ghosh et al.
A fitness function is introduced in terms of the variables (a
target
0
, r
target
0
) in ¯
S 2 (r) to
assess the fitness of the placement of GSEs in an instantiation of the SEVM.
=
a o − a
target
o
a
target
o
2
+
r o − r
target
o
r
target
o
2
(12)
This represents an error metric between the best fit parameters of the experimental
microstructure and a candidate SEVM.
The GA search process minimizes for a given microstructure. Only mutation
operators are considered in GA for evolving the population, as crossover operators
between microstructures tend to bias the morphological distributions and generate
frequent overlaps between precipitates. Candidate microstructures are updated
through mutation in one of two possible ways, viz., either perturbation of the GSE
centroids or swapping of Euler angles between two GSEs in the microstructure. For
viability of the perturbation method, the microstructure is checked for precipitate
to precipitate overlap. In the event of an unacceptable overlap, a different random
perturbation is attempted. The algorithm is terminated when the fitness function
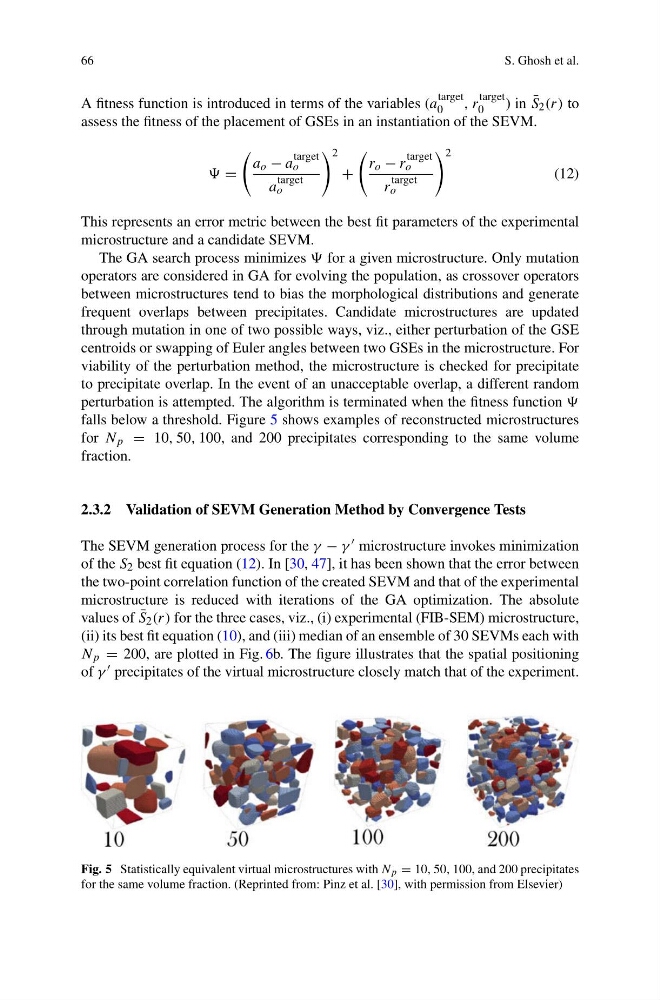
falls below a threshold. Figure 5 shows examples of reconstructed microstructures
for N p = 10, 50, 100, and 200 precipitates corresponding to the same volume
fraction.
2.3.2 Validation of SEVM Generation Method by Convergence Tests
The SEVM generation process for the γ − γ microstructure invokes minimization
of the S 2 best fit equation (12). In [30, 47], it has been shown that the error between
the two-point correlation function of the created SEVM and that of the experimental
microstructure is reduced with iterations of the GA optimization. The absolute
values of ¯
S 2 (r) for the three cases, viz., (i) experimental (FIB-SEM) microstructure,
(ii) its best fit equation (10), and (iii) median of an ensemble of 30 SEVMs each with
N p = 200, are plotted in Fig. 6b. The figure illustrates that the spatial positioning
of γ precipitates of the virtual microstructure closely match that of the experiment.
Fig. 5 Statistically equivalent virtual microstructures with N p = 10, 50, 100, and 200 precipitates
for the same volume fraction. (Reprinted from: Pinz et al. [30], with permission from Elsevier)
S. Ghosh et al.
A fitness function is introduced in terms of the variables (a
target
0
, r
target
0
) in ¯
S 2 (r) to
assess the fitness of the placement of GSEs in an instantiation of the SEVM.
=
a o − a
target
o
a
target
o
2
+
r o − r
target
o
r
target
o
2
(12)
This represents an error metric between the best fit parameters of the experimental
microstructure and a candidate SEVM.
The GA search process minimizes for a given microstructure. Only mutation
operators are considered in GA for evolving the population, as crossover operators
between microstructures tend to bias the morphological distributions and generate
frequent overlaps between precipitates. Candidate microstructures are updated
through mutation in one of two possible ways, viz., either perturbation of the GSE
centroids or swapping of Euler angles between two GSEs in the microstructure. For
viability of the perturbation method, the microstructure is checked for precipitate
to precipitate overlap. In the event of an unacceptable overlap, a different random
perturbation is attempted. The algorithm is terminated when the fitness function
falls below a threshold. Figure 5 shows examples of reconstructed microstructures
for N p = 10, 50, 100, and 200 precipitates corresponding to the same volume
fraction.
2.3.2 Validation of SEVM Generation Method by Convergence Tests
The SEVM generation process for the γ − γ microstructure invokes minimization
of the S 2 best fit equation (12). In [30, 47], it has been shown that the error between
the two-point correlation function of the created SEVM and that of the experimental
microstructure is reduced with iterations of the GA optimization. The absolute
values of ¯
S 2 (r) for the three cases, viz., (i) experimental (FIB-SEM) microstructure,
(ii) its best fit equation (10), and (iii) median of an ensemble of 30 SEVMs each with
N p = 200, are plotted in Fig. 6b. The figure illustrates that the spatial positioning
of γ precipitates of the virtual microstructure closely match that of the experiment.
Fig. 5 Statistically equivalent virtual microstructures with N p = 10, 50, 100, and 200 precipitates
for the same volume fraction. (Reprinted from: Pinz et al. [30], with permission from Elsevier)