

M-SERVE and P-SERVE
67
(a)
|
(b)
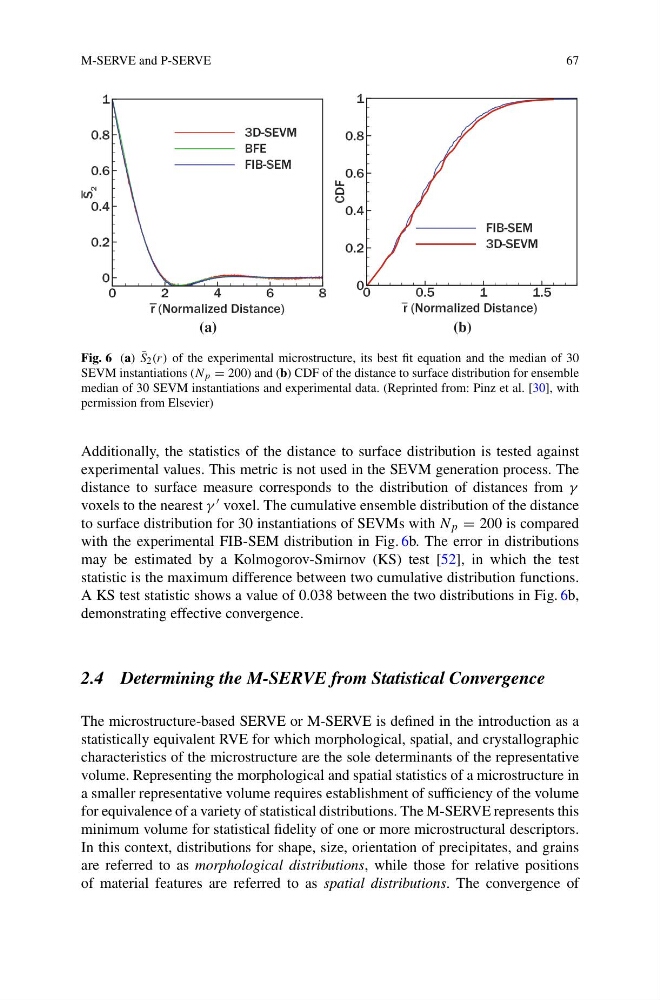
Fig. 6 (a) ¯
S 2 (r) of the experimental microstructure, its best fit equation and the median of 30
SEVM instantiations (N p = 200) and (b) CDF of the distance to surface distribution for ensemble
median of 30 SEVM instantiations and experimental data. (Reprinted from: Pinz et al. [30], with
permission from Elsevier)
Additionally, the statistics of the distance to surface distribution is tested against
experimental values. This metric is not used in the SEVM generation process. The
distance to surface measure corresponds to the distribution of distances from γ
voxels to the nearest γ voxel. The cumulative ensemble distribution of the distance
to surface distribution for 30 instantiations of SEVMs with N p = 200 is compared
with the experimental FIB-SEM distribution in Fig. 6b. The error in distributions
may be estimated by a Kolmogorov-Smirnov (KS) test [52], in which the test
statistic is the maximum difference between two cumulative distribution functions.
A KS test statistic shows a value of 0.038 between the two distributions in Fig. 6b,
demonstrating effective convergence.
2.4 Determining the M-SERVE from Statistical Convergence
The microstructure-based SERVE or M-SERVE is defined in the introduction as a
statistically equivalent RVE for which morphological, spatial, and crystallographic
characteristics of the microstructure are the sole determinants of the representative
volume. Representing the morphological and spatial statistics of a microstructure in
a smaller representative volume requires establishment of sufficiency of the volume
for equivalence of a variety of statistical distributions. The M-SERVE represents this
minimum volume for statistical fidelity of one or more microstructural descriptors.
In this context, distributions for shape, size, orientation of precipitates, and grains
are referred to as morphological distributions, while those for relative positions
of material features are referred to as spatial distributions. The convergence of
67
(a)
|
(b)
Fig. 6 (a) ¯
S 2 (r) of the experimental microstructure, its best fit equation and the median of 30
SEVM instantiations (N p = 200) and (b) CDF of the distance to surface distribution for ensemble
median of 30 SEVM instantiations and experimental data. (Reprinted from: Pinz et al. [30], with
permission from Elsevier)
Additionally, the statistics of the distance to surface distribution is tested against
experimental values. This metric is not used in the SEVM generation process. The
distance to surface measure corresponds to the distribution of distances from γ
voxels to the nearest γ voxel. The cumulative ensemble distribution of the distance
to surface distribution for 30 instantiations of SEVMs with N p = 200 is compared
with the experimental FIB-SEM distribution in Fig. 6b. The error in distributions
may be estimated by a Kolmogorov-Smirnov (KS) test [52], in which the test
statistic is the maximum difference between two cumulative distribution functions.
A KS test statistic shows a value of 0.038 between the two distributions in Fig. 6b,
demonstrating effective convergence.
2.4 Determining the M-SERVE from Statistical Convergence
The microstructure-based SERVE or M-SERVE is defined in the introduction as a
statistically equivalent RVE for which morphological, spatial, and crystallographic
characteristics of the microstructure are the sole determinants of the representative
volume. Representing the morphological and spatial statistics of a microstructure in
a smaller representative volume requires establishment of sufficiency of the volume
for equivalence of a variety of statistical distributions. The M-SERVE represents this
minimum volume for statistical fidelity of one or more microstructural descriptors.
In this context, distributions for shape, size, orientation of precipitates, and grains
are referred to as morphological distributions, while those for relative positions
of material features are referred to as spatial distributions. The convergence of