

364
A. Agrawal et al.
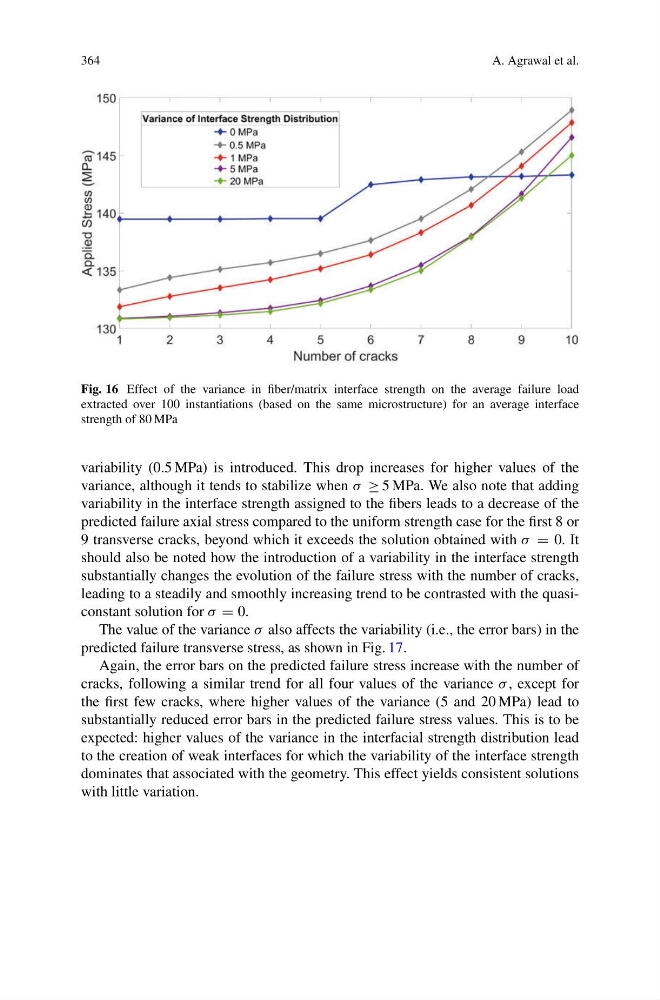
Fig. 16 Effect of the variance in fiber/matrix interface strength on the average failure load
extracted over 100 instantiations (based on the same microstructure) for an average interface
strength of 80 MPa
variability (0.5 MPa) is introduced. This drop increases for higher values of the
variance, although it tends to stabilize when σ ≥ 5 MPa. We also note that adding
variability in the interface strength assigned to the fibers leads to a decrease of the
predicted failure axial stress compared to the uniform strength case for the first 8 or
9 transverse cracks, beyond which it exceeds the solution obtained with σ = 0. It
should also be noted how the introduction of a variability in the interface strength
substantially changes the evolution of the failure stress with the number of cracks,
leading to a steadily and smoothly increasing trend to be contrasted with the quasiconstant solution for σ = 0.
The value of the variance σ also affects the variability (i.e., the error bars) in the
predicted failure transverse stress, as shown in Fig. 17.
Again, the error bars on the predicted failure stress increase with the number of
cracks, following a similar trend for all four values of the variance σ , except for
the first few cracks, where higher values of the variance (5 and 20 MPa) lead to
substantially reduced error bars in the predicted failure stress values. This is to be
expected: higher values of the variance in the interfacial strength distribution lead
to the creation of weak interfaces for which the variability of the interface strength
dominates that associated with the geometry. This effect yields consistent solutions
with little variation.
A. Agrawal et al.
Fig. 16 Effect of the variance in fiber/matrix interface strength on the average failure load
extracted over 100 instantiations (based on the same microstructure) for an average interface
strength of 80 MPa
variability (0.5 MPa) is introduced. This drop increases for higher values of the
variance, although it tends to stabilize when σ ≥ 5 MPa. We also note that adding
variability in the interface strength assigned to the fibers leads to a decrease of the
predicted failure axial stress compared to the uniform strength case for the first 8 or
9 transverse cracks, beyond which it exceeds the solution obtained with σ = 0. It
should also be noted how the introduction of a variability in the interface strength
substantially changes the evolution of the failure stress with the number of cracks,
leading to a steadily and smoothly increasing trend to be contrasted with the quasiconstant solution for σ = 0.
The value of the variance σ also affects the variability (i.e., the error bars) in the
predicted failure transverse stress, as shown in Fig. 17.
Again, the error bars on the predicted failure stress increase with the number of
cracks, following a similar trend for all four values of the variance σ , except for
the first few cracks, where higher values of the variance (5 and 20 MPa) lead to
substantially reduced error bars in the predicted failure stress values. This is to be
expected: higher values of the variance in the interfacial strength distribution lead
to the creation of weak interfaces for which the variability of the interface strength
dominates that associated with the geometry. This effect yields consistent solutions
with little variation.