

Geometric Modeling of Transverse Cracking of Composites
363
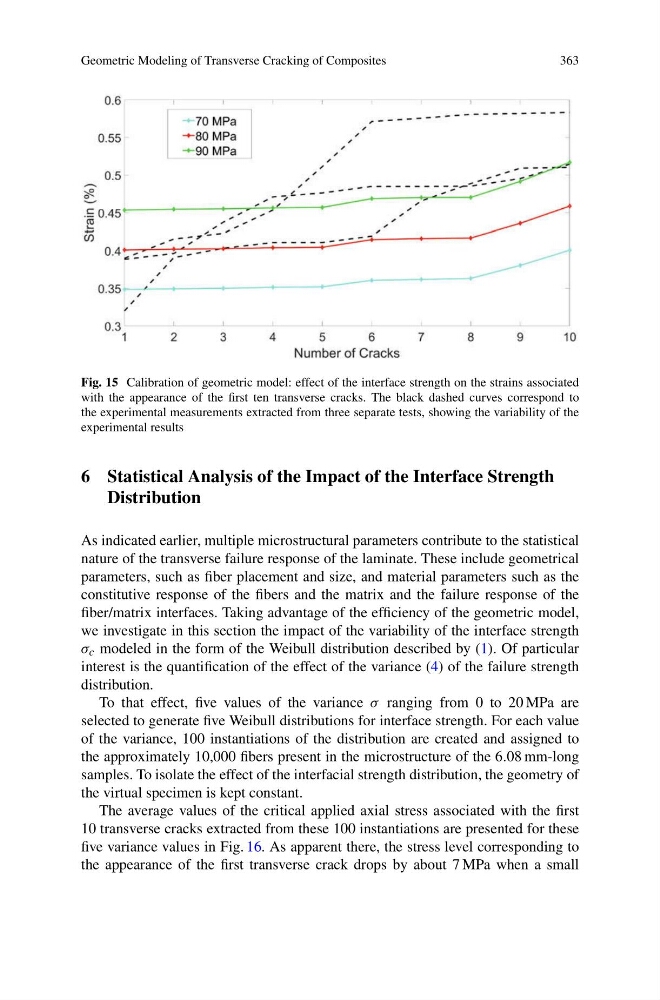
Fig. 15 Calibration of geometric model: effect of the interface strength on the strains associated
with the appearance of the first ten transverse cracks. The black dashed curves correspond to
the experimental measurements extracted from three separate tests, showing the variability of the
experimental results
6 Statistical Analysis of the Impact of the Interface Strength
Distribution
As indicated earlier, multiple microstructural parameters contribute to the statistical
nature of the transverse failure response of the laminate. These include geometrical
parameters, such as fiber placement and size, and material parameters such as the
constitutive response of the fibers and the matrix and the failure response of the
fiber/matrix interfaces. Taking advantage of the efficiency of the geometric model,
we investigate in this section the impact of the variability of the interface strength
σ c modeled in the form of the Weibull distribution described by (1). Of particular
interest is the quantification of the effect of the variance (4) of the failure strength
distribution.
To that effect, five values of the variance σ ranging from 0 to 20 MPa are
selected to generate five Weibull distributions for interface strength. For each value
of the variance, 100 instantiations of the distribution are created and assigned to
the approximately 10,000 fibers present in the microstructure of the 6.08 mm-long
samples. To isolate the effect of the interfacial strength distribution, the geometry of
the virtual specimen is kept constant.
The average values of the critical applied axial stress associated with the first
10 transverse cracks extracted from these 100 instantiations are presented for these
five variance values in Fig. 16. As apparent there, the stress level corresponding to
the appearance of the first transverse crack drops by about 7 MPa when a small
363
Fig. 15 Calibration of geometric model: effect of the interface strength on the strains associated
with the appearance of the first ten transverse cracks. The black dashed curves correspond to
the experimental measurements extracted from three separate tests, showing the variability of the
experimental results
6 Statistical Analysis of the Impact of the Interface Strength
Distribution
As indicated earlier, multiple microstructural parameters contribute to the statistical
nature of the transverse failure response of the laminate. These include geometrical
parameters, such as fiber placement and size, and material parameters such as the
constitutive response of the fibers and the matrix and the failure response of the
fiber/matrix interfaces. Taking advantage of the efficiency of the geometric model,
we investigate in this section the impact of the variability of the interface strength
σ c modeled in the form of the Weibull distribution described by (1). Of particular
interest is the quantification of the effect of the variance (4) of the failure strength
distribution.
To that effect, five values of the variance σ ranging from 0 to 20 MPa are
selected to generate five Weibull distributions for interface strength. For each value
of the variance, 100 instantiations of the distribution are created and assigned to
the approximately 10,000 fibers present in the microstructure of the 6.08 mm-long
samples. To isolate the effect of the interfacial strength distribution, the geometry of
the virtual specimen is kept constant.
The average values of the critical applied axial stress associated with the first
10 transverse cracks extracted from these 100 instantiations are presented for these
five variance values in Fig. 16. As apparent there, the stress level corresponding to
the appearance of the first transverse crack drops by about 7 MPa when a small