

362
A. Agrawal et al.
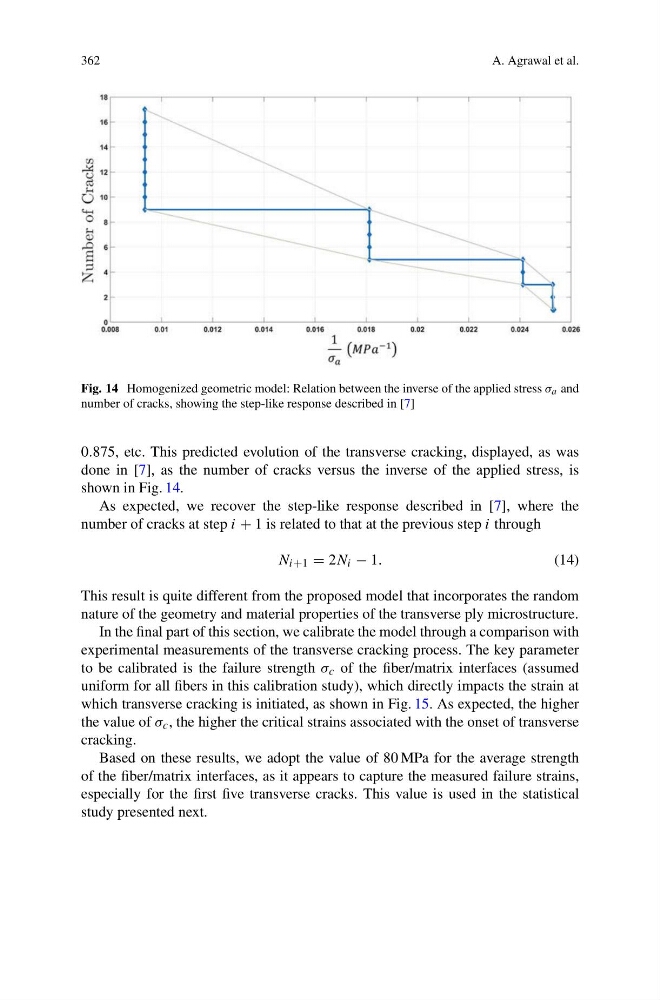
Fig. 14 Homogenized geometric model: Relation between the inverse of the applied stress σ a and
number of cracks, showing the step-like response described in [7]
0.875, etc. This predicted evolution of the transverse cracking, displayed, as was
done in [7], as the number of cracks versus the inverse of the applied stress, is
shown in Fig. 14.
As expected, we recover the step-like response described in [7], where the
number of cracks at step i + 1 is related to that at the previous step i through
N i+1 = 2N i − 1.
(14)
This result is quite different from the proposed model that incorporates the random
nature of the geometry and material properties of the transverse ply microstructure.
In the final part of this section, we calibrate the model through a comparison with
experimental measurements of the transverse cracking process. The key parameter
to be calibrated is the failure strength σ c of the fiber/matrix interfaces (assumed
uniform for all fibers in this calibration study), which directly impacts the strain at
which transverse cracking is initiated, as shown in Fig. 15. As expected, the higher
the value of σ c , the higher the critical strains associated with the onset of transverse
cracking.
Based on these results, we adopt the value of 80 MPa for the average strength
of the fiber/matrix interfaces, as it appears to capture the measured failure strains,
especially for the first five transverse cracks. This value is used in the statistical
study presented next.
A. Agrawal et al.
Fig. 14 Homogenized geometric model: Relation between the inverse of the applied stress σ a and
number of cracks, showing the step-like response described in [7]
0.875, etc. This predicted evolution of the transverse cracking, displayed, as was
done in [7], as the number of cracks versus the inverse of the applied stress, is
shown in Fig. 14.
As expected, we recover the step-like response described in [7], where the
number of cracks at step i + 1 is related to that at the previous step i through
N i+1 = 2N i − 1.
(14)
This result is quite different from the proposed model that incorporates the random
nature of the geometry and material properties of the transverse ply microstructure.
In the final part of this section, we calibrate the model through a comparison with
experimental measurements of the transverse cracking process. The key parameter
to be calibrated is the failure strength σ c of the fiber/matrix interfaces (assumed
uniform for all fibers in this calibration study), which directly impacts the strain at
which transverse cracking is initiated, as shown in Fig. 15. As expected, the higher
the value of σ c , the higher the critical strains associated with the onset of transverse
cracking.
Based on these results, we adopt the value of 80 MPa for the average strength
of the fiber/matrix interfaces, as it appears to capture the measured failure strains,
especially for the first five transverse cracks. This value is used in the statistical
study presented next.