

360
A. Agrawal et al.
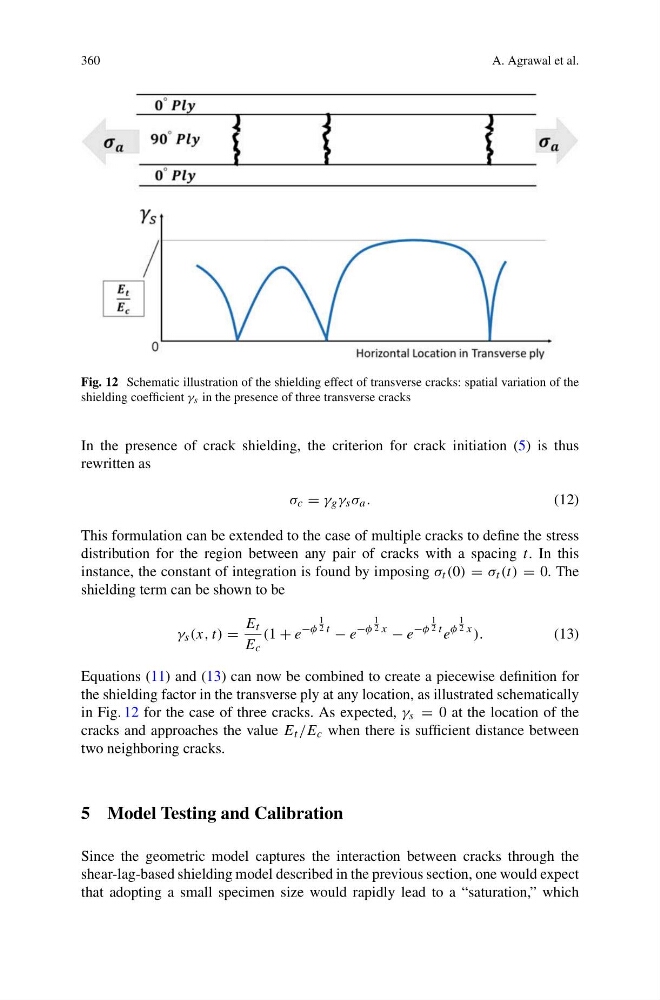
Fig. 12 Schematic illustration of the shielding effect of transverse cracks: spatial variation of the
shielding coefficient γ s in the presence of three transverse cracks
In the presence of crack shielding, the criterion for crack initiation (5) is thus
rewritten as
σ c = γ g γ s σ a .
(12)
This formulation can be extended to the case of multiple cracks to define the stress
distribution for the region between any pair of cracks with a spacing t. In this
instance, the constant of integration is found by imposing σ t (0) = σ t (t) = 0. The
shielding term can be shown to be
γ s (x, t) =
E t
E c
(1 + e
−φ
1
2 t
− e
−φ
1
2 x
− e
−φ
1
2 t e
φ
1
2 x ).
(13)
Equations (11) and (13) can now be combined to create a piecewise definition for
the shielding factor in the transverse ply at any location, as illustrated schematically
in Fig. 12 for the case of three cracks. As expected, γ s = 0 at the location of the
cracks and approaches the value E t /E c when there is sufficient distance between
two neighboring cracks.
5 Model Testing and Calibration
Since the geometric model captures the interaction between cracks through the
shear-lag-based shielding model described in the previous section, one would expect
that adopting a small specimen size would rapidly lead to a “saturation,” which
A. Agrawal et al.
Fig. 12 Schematic illustration of the shielding effect of transverse cracks: spatial variation of the
shielding coefficient γ s in the presence of three transverse cracks
In the presence of crack shielding, the criterion for crack initiation (5) is thus
rewritten as
σ c = γ g γ s σ a .
(12)
This formulation can be extended to the case of multiple cracks to define the stress
distribution for the region between any pair of cracks with a spacing t. In this
instance, the constant of integration is found by imposing σ t (0) = σ t (t) = 0. The
shielding term can be shown to be
γ s (x, t) =
E t
E c
(1 + e
−φ
1
2 t
− e
−φ
1
2 x
− e
−φ
1
2 t e
φ
1
2 x ).
(13)
Equations (11) and (13) can now be combined to create a piecewise definition for
the shielding factor in the transverse ply at any location, as illustrated schematically
in Fig. 12 for the case of three cracks. As expected, γ s = 0 at the location of the
cracks and approaches the value E t /E c when there is sufficient distance between
two neighboring cracks.
5 Model Testing and Calibration
Since the geometric model captures the interaction between cracks through the
shear-lag-based shielding model described in the previous section, one would expect
that adopting a small specimen size would rapidly lead to a “saturation,” which