

Geometric Modeling of Transverse Cracking of Composites
357
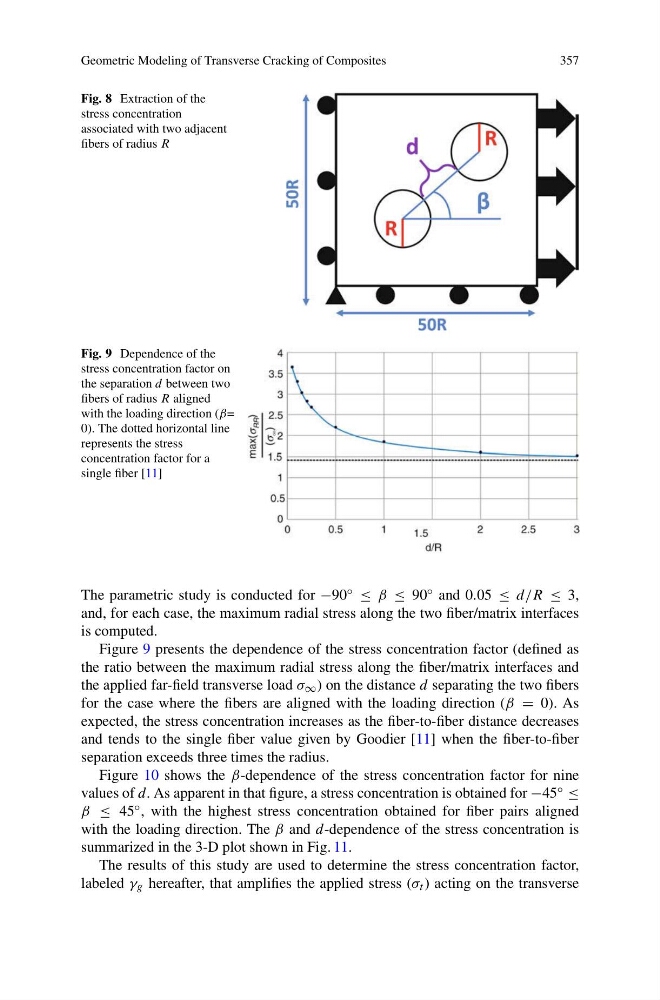
Fig. 8 Extraction of the
stress concentration
associated with two adjacent
fibers of radius R
Fig. 9 Dependence of the
stress concentration factor on
the separation d between two
fibers of radius R aligned
with the loading direction (β=
0). The dotted horizontal line
represents the stress
concentration factor for a
single fiber [11]
The parametric study is conducted for −90 ◦ ≤ β ≤ 90 ◦ and 0.05 ≤ d/R ≤ 3,
and, for each case, the maximum radial stress along the two fiber/matrix interfaces
is computed.
Figure 9 presents the dependence of the stress concentration factor (defined as
the ratio between the maximum radial stress along the fiber/matrix interfaces and
the applied far-field transverse load σ ∞ ) on the distance d separating the two fibers
for the case where the fibers are aligned with the loading direction (β = 0). As
expected, the stress concentration increases as the fiber-to-fiber distance decreases
and tends to the single fiber value given by Goodier [11] when the fiber-to-fiber
separation exceeds three times the radius.
Figure 10 shows the β-dependence of the stress concentration factor for nine
values of d. As apparent in that figure, a stress concentration is obtained for −45 ◦ ≤
β ≤ 45 ◦ , with the highest stress concentration obtained for fiber pairs aligned
with the loading direction. The β and d-dependence of the stress concentration is
summarized in the 3-D plot shown in Fig. 11.
The results of this study are used to determine the stress concentration factor,
labeled γ g hereafter, that amplifies the applied stress (σ t ) acting on the transverse
357
Fig. 8 Extraction of the
stress concentration
associated with two adjacent
fibers of radius R
Fig. 9 Dependence of the
stress concentration factor on
the separation d between two
fibers of radius R aligned
with the loading direction (β=
0). The dotted horizontal line
represents the stress
concentration factor for a
single fiber [11]
The parametric study is conducted for −90 ◦ ≤ β ≤ 90 ◦ and 0.05 ≤ d/R ≤ 3,
and, for each case, the maximum radial stress along the two fiber/matrix interfaces
is computed.
Figure 9 presents the dependence of the stress concentration factor (defined as
the ratio between the maximum radial stress along the fiber/matrix interfaces and
the applied far-field transverse load σ ∞ ) on the distance d separating the two fibers
for the case where the fibers are aligned with the loading direction (β = 0). As
expected, the stress concentration increases as the fiber-to-fiber distance decreases
and tends to the single fiber value given by Goodier [11] when the fiber-to-fiber
separation exceeds three times the radius.
Figure 10 shows the β-dependence of the stress concentration factor for nine
values of d. As apparent in that figure, a stress concentration is obtained for −45 ◦ ≤
β ≤ 45 ◦ , with the highest stress concentration obtained for fiber pairs aligned
with the loading direction. The β and d-dependence of the stress concentration is
summarized in the 3-D plot shown in Fig. 11.
The results of this study are used to determine the stress concentration factor,
labeled γ g hereafter, that amplifies the applied stress (σ t ) acting on the transverse