

338
S. Zacek et al.
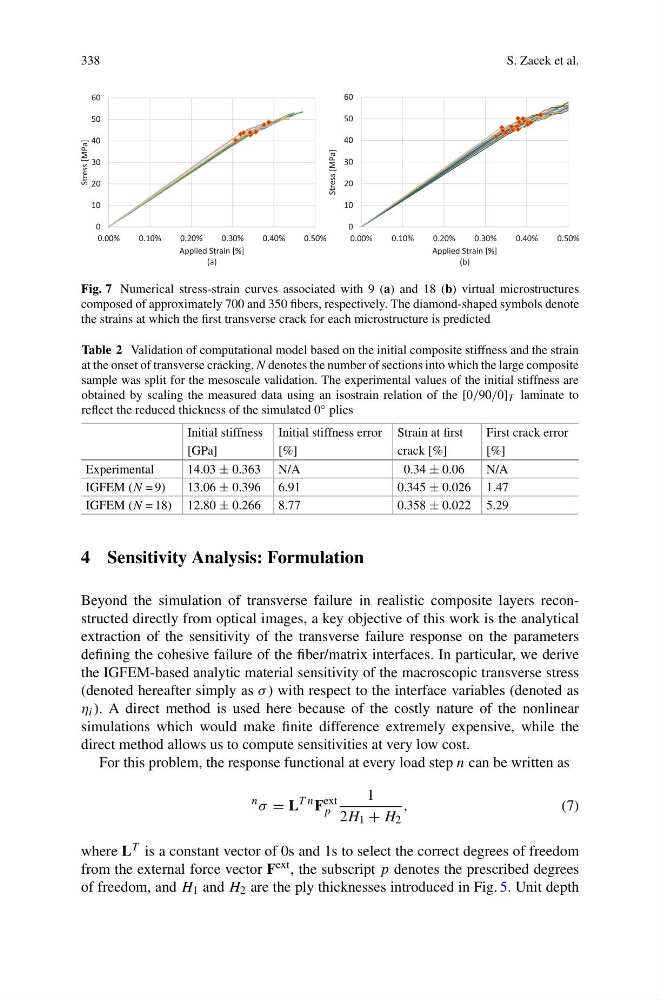
Fig. 7 Numerical stress-strain curves associated with 9 (a) and 18 (b) virtual microstructures
composed of approximately 700 and 350 fibers, respectively. The diamond-shaped symbols denote
the strains at which the first transverse crack for each microstructure is predicted
Table 2 Validation of computational model based on the initial composite stiffness and the strain
at the onset of transverse cracking. N denotes the number of sections into which the large composite
sample was split for the mesoscale validation. The experimental values of the initial stiffness are
obtained by scaling the measured data using an isostrain relation of the [0/90/0] T laminate to
reflect the reduced thickness of the simulated 0 ◦ plies
Initial stiffness Initial stiffness error Strain at first
First crack error
[GPa]
[%]
crack [%]
[%]
Experimental
14.03 ± 0.363 N/A
0.34 ± 0.06
N/A
IGFEM (N = 9)
13.06 ± 0.396 6.91
0.345 ± 0.026 1.47
IGFEM (N = 18) 12.80 ± 0.266 8.77
0.358 ± 0.022 5.29
4 Sensitivity Analysis: Formulation
Beyond the simulation of transverse failure in realistic composite layers reconstructed directly from optical images, a key objective of this work is the analytical
extraction of the sensitivity of the transverse failure response on the parameters
defining the cohesive failure of the fiber/matrix interfaces. In particular, we derive
the IGFEM-based analytic material sensitivity of the macroscopic transverse stress
(denoted hereafter simply as σ ) with respect to the interface variables (denoted as
η i ). A direct method is used here because of the costly nature of the nonlinear
simulations which would make finite difference extremely expensive, while the
direct method allows us to compute sensitivities at very low cost.
For this problem, the response functional at every load step n can be written as
n σ = L
T n F
ext
p
1
2H 1 + H 2
,
(7)
where L T is a constant vector of 0s and 1s to select the correct degrees of freedom
from the external force vector F ext , the subscript p denotes the prescribed degrees
of freedom, and H 1 and H 2 are the ply thicknesses introduced in Fig. 5. Unit depth
S. Zacek et al.
Fig. 7 Numerical stress-strain curves associated with 9 (a) and 18 (b) virtual microstructures
composed of approximately 700 and 350 fibers, respectively. The diamond-shaped symbols denote
the strains at which the first transverse crack for each microstructure is predicted
Table 2 Validation of computational model based on the initial composite stiffness and the strain
at the onset of transverse cracking. N denotes the number of sections into which the large composite
sample was split for the mesoscale validation. The experimental values of the initial stiffness are
obtained by scaling the measured data using an isostrain relation of the [0/90/0] T laminate to
reflect the reduced thickness of the simulated 0 ◦ plies
Initial stiffness Initial stiffness error Strain at first
First crack error
[GPa]
[%]
crack [%]
[%]
Experimental
14.03 ± 0.363 N/A
0.34 ± 0.06
N/A
IGFEM (N = 9)
13.06 ± 0.396 6.91
0.345 ± 0.026 1.47
IGFEM (N = 18) 12.80 ± 0.266 8.77
0.358 ± 0.022 5.29
4 Sensitivity Analysis: Formulation
Beyond the simulation of transverse failure in realistic composite layers reconstructed directly from optical images, a key objective of this work is the analytical
extraction of the sensitivity of the transverse failure response on the parameters
defining the cohesive failure of the fiber/matrix interfaces. In particular, we derive
the IGFEM-based analytic material sensitivity of the macroscopic transverse stress
(denoted hereafter simply as σ ) with respect to the interface variables (denoted as
η i ). A direct method is used here because of the costly nature of the nonlinear
simulations which would make finite difference extremely expensive, while the
direct method allows us to compute sensitivities at very low cost.
For this problem, the response functional at every load step n can be written as
n σ = L
T n F
ext
p
1
2H 1 + H 2
,
(7)
where L T is a constant vector of 0s and 1s to select the correct degrees of freedom
from the external force vector F ext , the subscript p denotes the prescribed degrees
of freedom, and H 1 and H 2 are the ply thicknesses introduced in Fig. 5. Unit depth